At 8:30 a.m. EST on Sunday, bitcoin traded near $71,754 on March 15, 2026, consolidating within a narrow $70,540 to $71,893 intraday range while the broader technical picture leaned mildly constructive. With a market cap of $1.44 trillion and 24-hour trading volume above $22.5 billion, the world’s largest cryptocurrency continued to hover inside a well-defined consolidation band visible across multiple timeframes.
Bitcoin Chart Outlook: Price Coils Near $72K as Momentum Indicators Quietly Warm Up
Price action across the daily bitcoin chart suggests bitcoin remains in a classic post-rally digestion phase, which requires a great deal of patience. After carving a swing low near $62,525 and rallying to a recent peak around $74,075, the asset has since retreated into a sideways structure bounded roughly between $70,500 and $72,500.
Recent daily candles feature smaller bodies and alternating colors, a visual signal of market indecision following the prior impulsive advance. Volume has tapered off notably since the peak, reinforcing the idea that both bullish enthusiasm and bearish urgency are temporarily on mute while the market searches for direction.
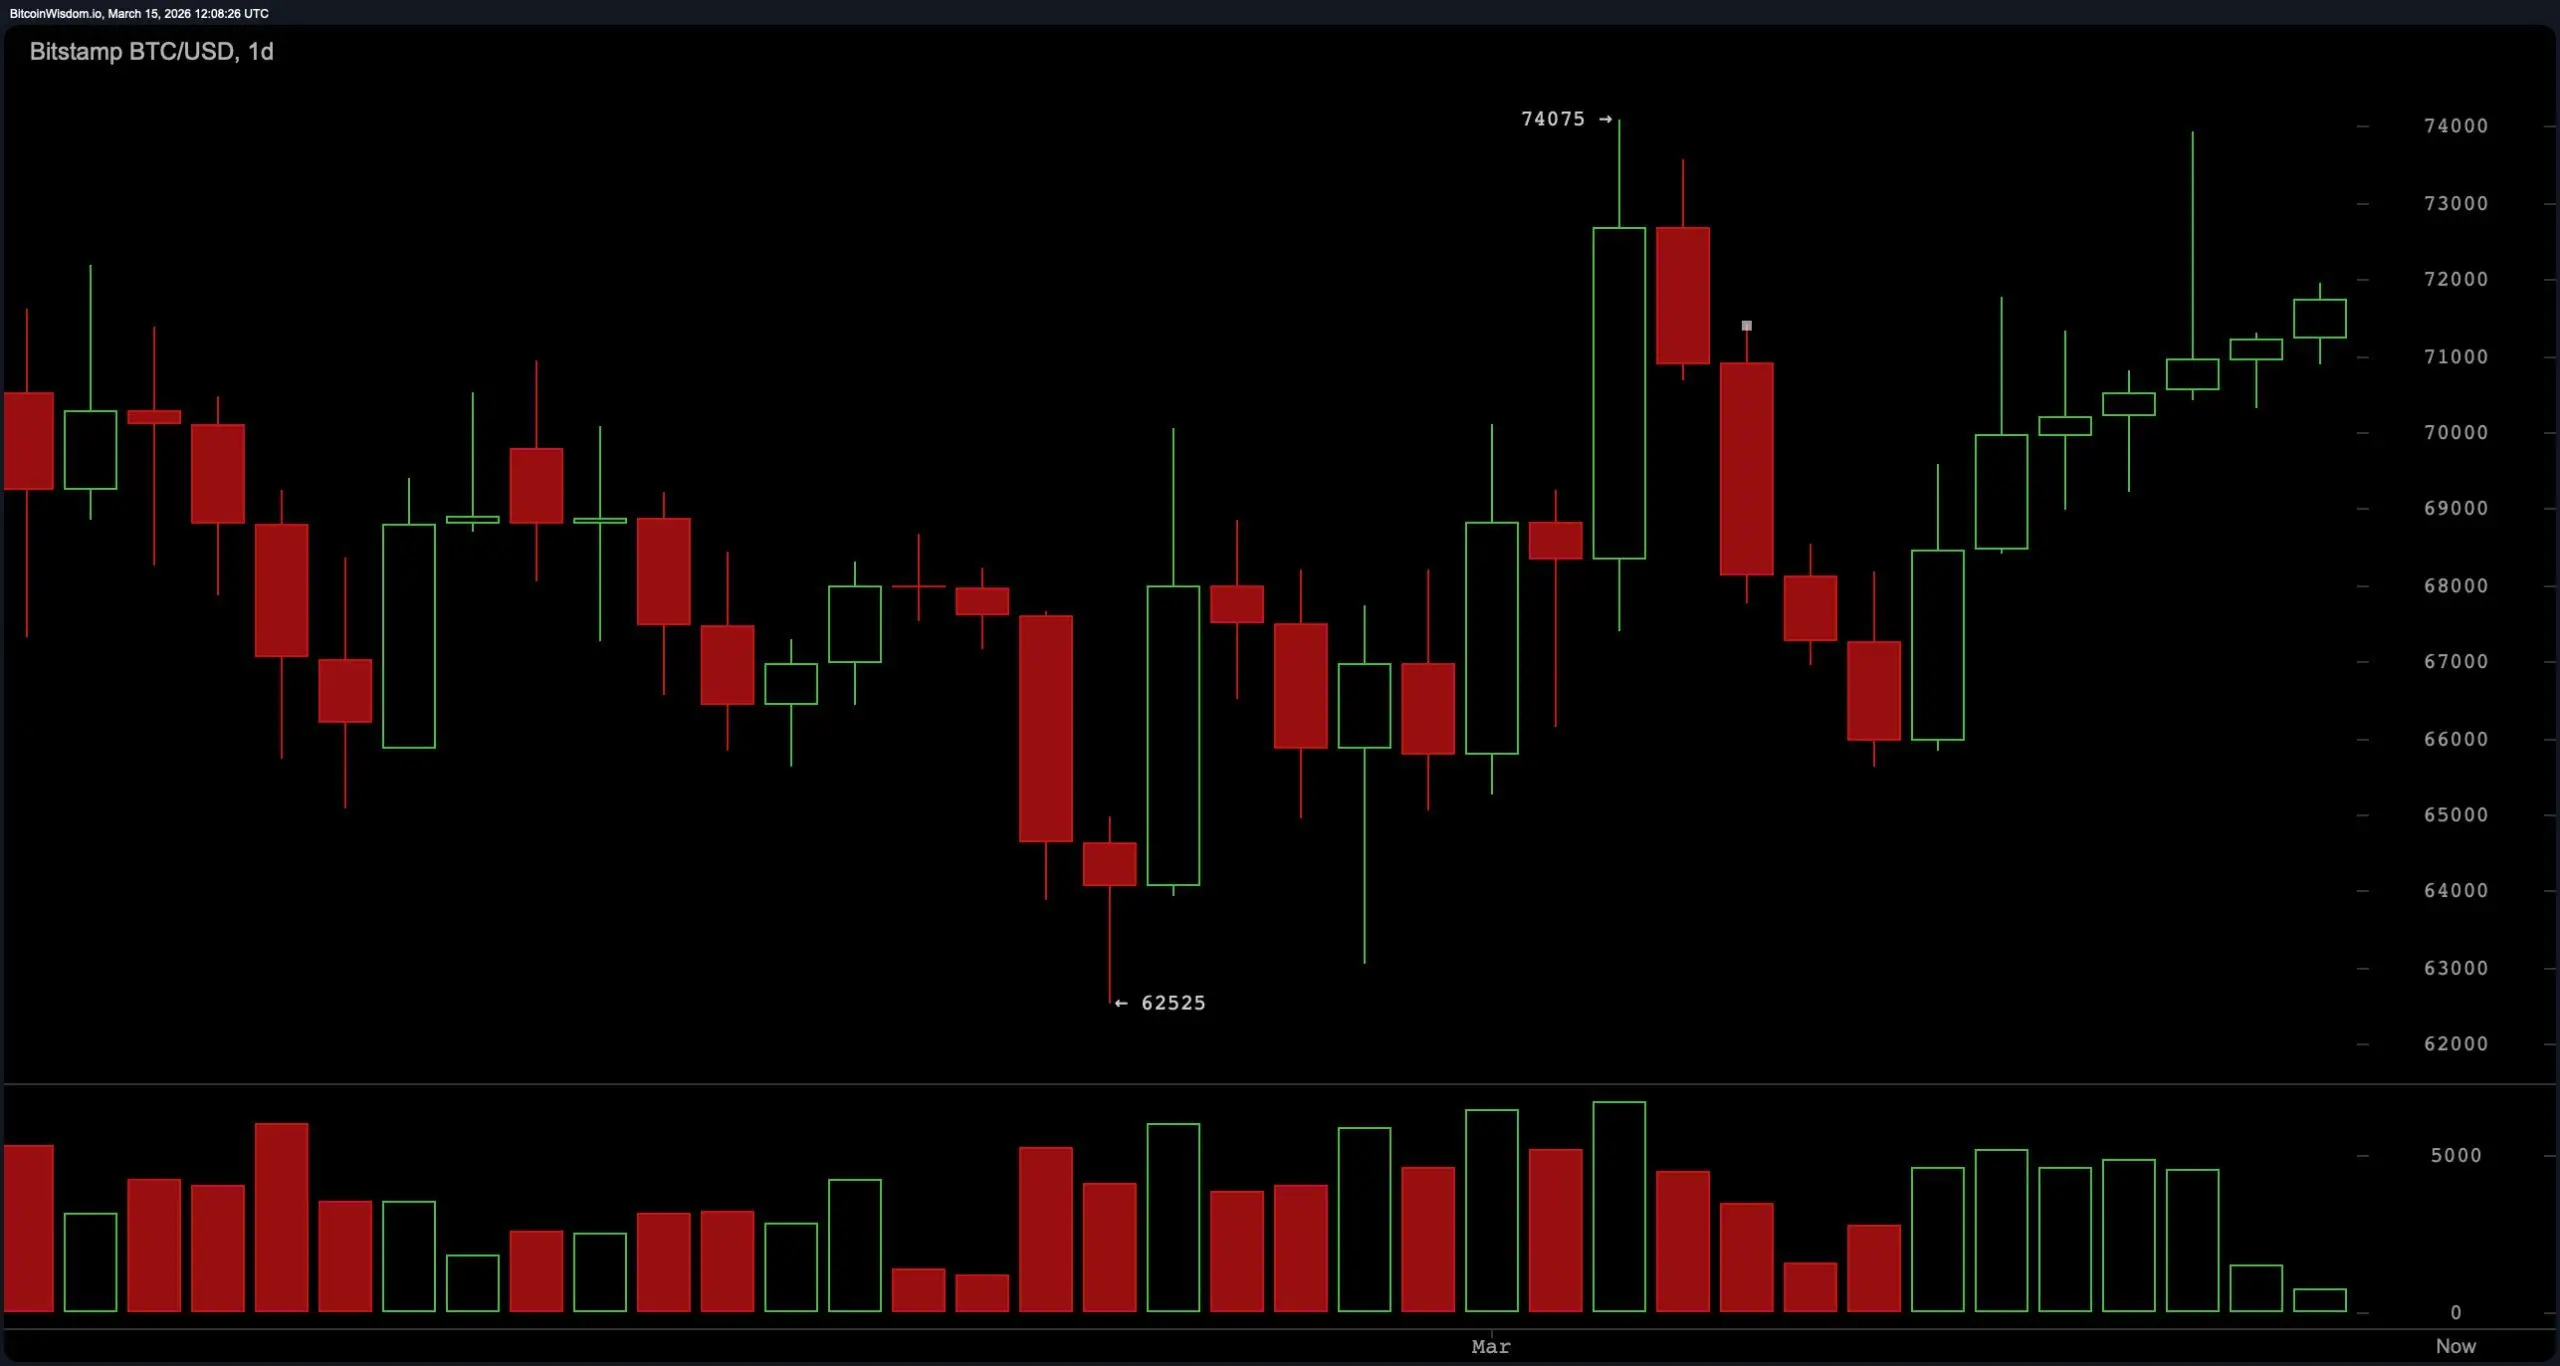 BTC/USD 1-day chart via Bitstamp on March 15, 2026.
The four-hour chart tells a similar story but adds a little more texture to the short-term narrative. Bitcoin reached roughly $73,933 around March 13 before pulling back sharply into the low-$70,000 range. The decline arrived on heavier volume, while the subsequent rebound toward the $71,900 area occurred on lighter activity. That imbalance hints that the rebound is more corrective than explosive, though price continues to hover above key short-term demand near $70,500 to $71,000. For now, the intermediate trend remains boxed between resistance near $72,500 and support clustered just above $70,000.
BTC/USD 1-day chart via Bitstamp on March 15, 2026.
The four-hour chart tells a similar story but adds a little more texture to the short-term narrative. Bitcoin reached roughly $73,933 around March 13 before pulling back sharply into the low-$70,000 range. The decline arrived on heavier volume, while the subsequent rebound toward the $71,900 area occurred on lighter activity. That imbalance hints that the rebound is more corrective than explosive, though price continues to hover above key short-term demand near $70,500 to $71,000. For now, the intermediate trend remains boxed between resistance near $72,500 and support clustered just above $70,000.
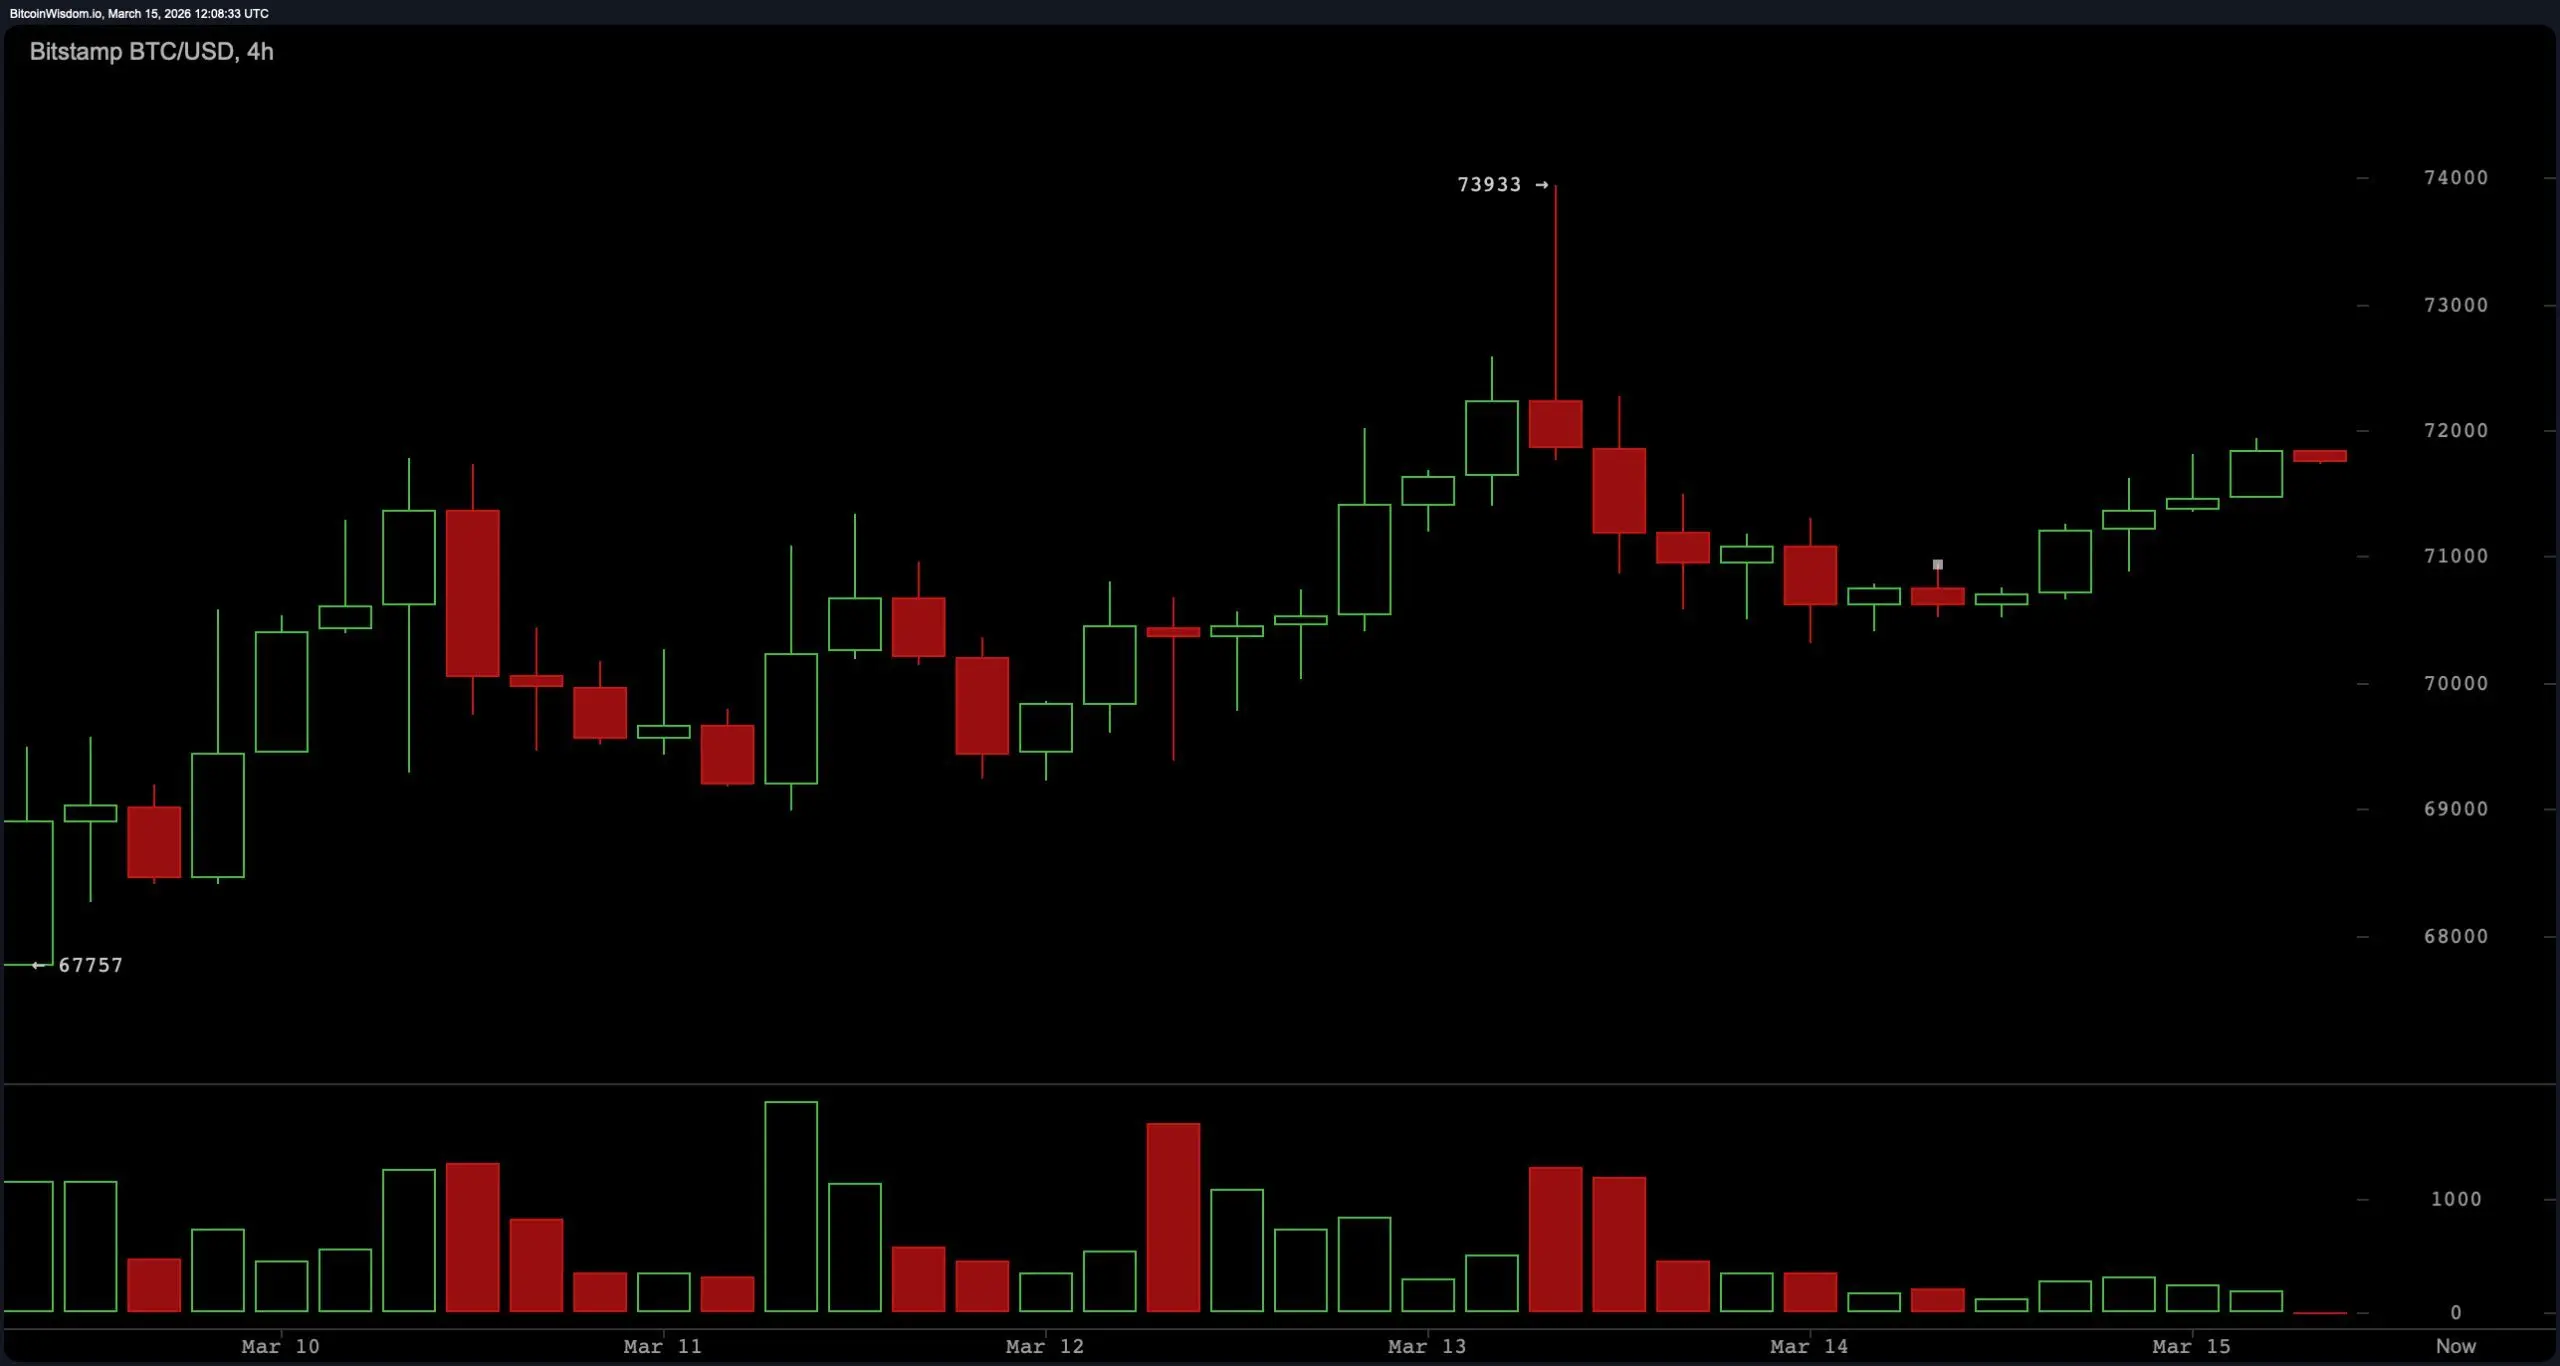 BTC/USD 4-hour chart via Bitstamp on March 15, 2026.
Zooming into the one-hour chart, price behavior resembles a slow staircase higher following a bounce near $70,305 on March 14. Candles are relatively small, and volume remains subdued, a technical signature often associated with consolidation or “coiling” behavior before a directional move. Price has hovered around the $71,268 to $71,940 region with minimal volatility, suggesting traders are watching the same levels: resistance near $72,000 and support around $70,300. In other words, the market appears content to wait for a catalyst rather than manufacture one.
BTC/USD 4-hour chart via Bitstamp on March 15, 2026.
Zooming into the one-hour chart, price behavior resembles a slow staircase higher following a bounce near $70,305 on March 14. Candles are relatively small, and volume remains subdued, a technical signature often associated with consolidation or “coiling” behavior before a directional move. Price has hovered around the $71,268 to $71,940 region with minimal volatility, suggesting traders are watching the same levels: resistance near $72,000 and support around $70,300. In other words, the market appears content to wait for a catalyst rather than manufacture one.
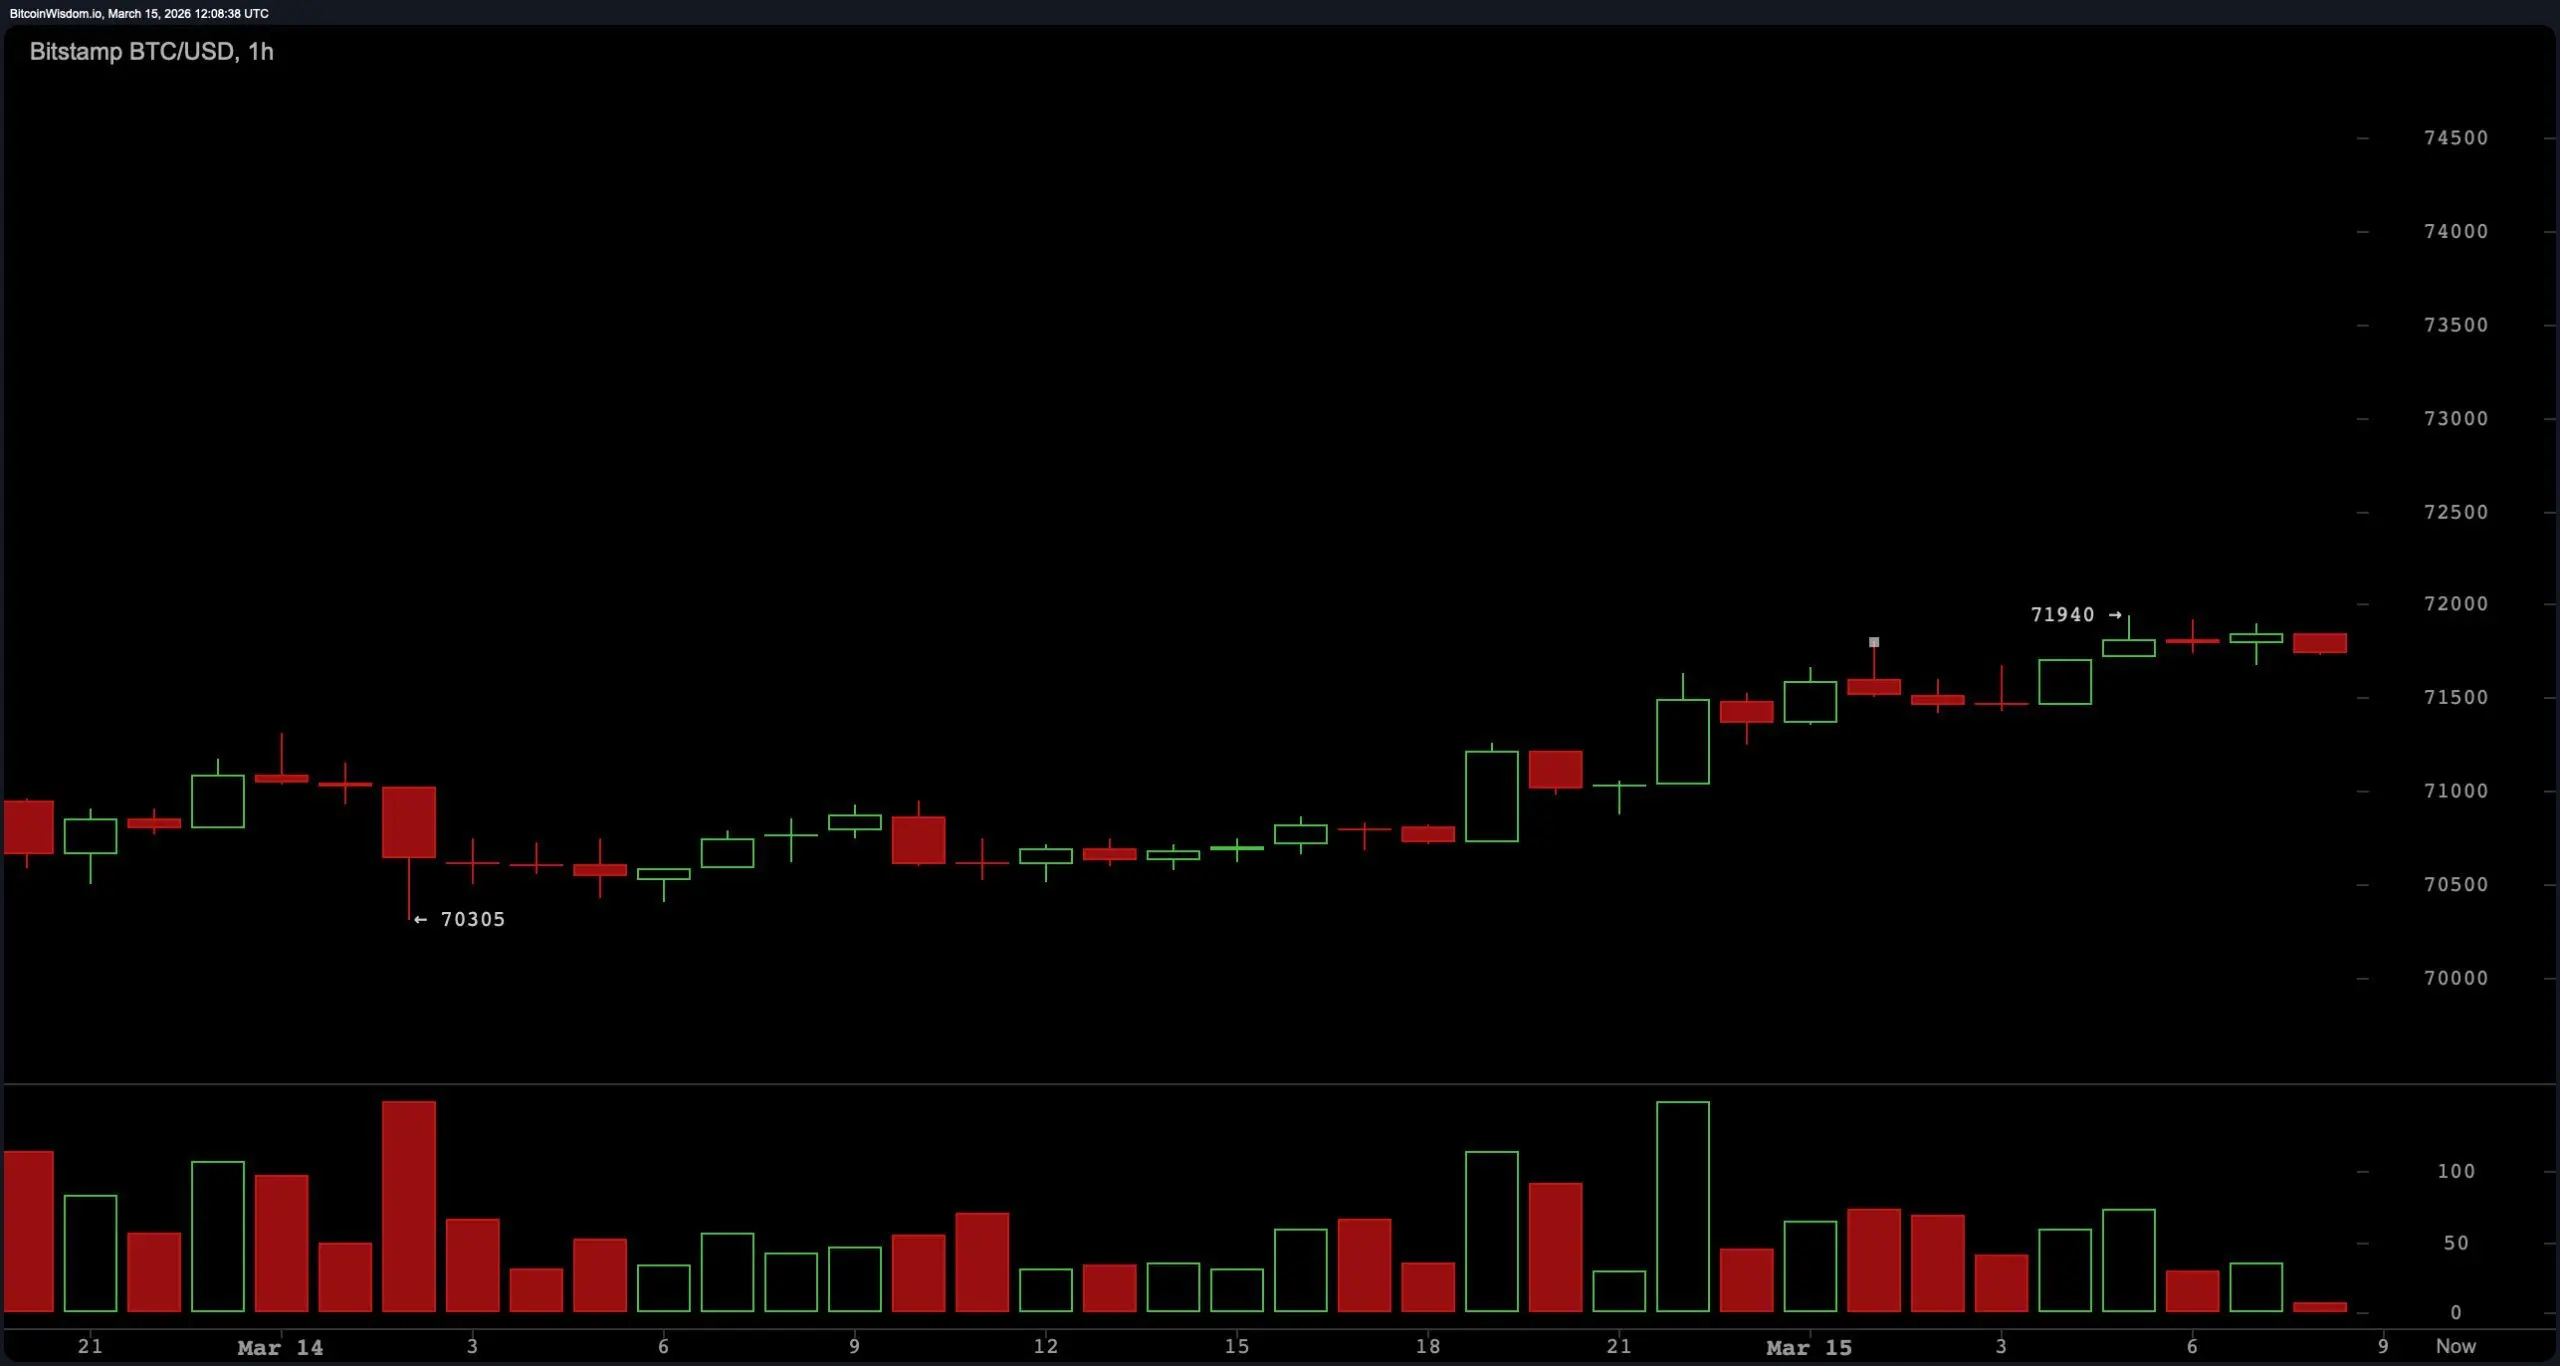 BTC/USD 1-hour chart via Bitstamp on March 15, 2026.
Momentum oscillators reinforce the theme of cautious neutrality with a slight upward tilt. The relative strength index ( RSI) stands at 55, squarely in neutral territory but comfortably above the midpoint that often separates bullish and bearish momentum. The Stochastic oscillator sits at 71, indicating upward momentum without yet reaching overbought conditions.
BTC/USD 1-hour chart via Bitstamp on March 15, 2026.
Momentum oscillators reinforce the theme of cautious neutrality with a slight upward tilt. The relative strength index ( RSI) stands at 55, squarely in neutral territory but comfortably above the midpoint that often separates bullish and bearish momentum. The Stochastic oscillator sits at 71, indicating upward momentum without yet reaching overbought conditions.
The commodity channel index (CCI) reads 101, suggesting modest strength, while the average directional index (ADX) at 25 signals that trend intensity remains relatively mild. Meanwhile, the awesome oscillator prints 2,649 in neutral territory, while momentum (10) and moving average convergence divergence ( MACD) both register positive signals, implying underlying upward pressure is quietly building even if price itself hasn’t gotten the memo yet.
Moving averages (MAs) paint a mixed but slightly supportive picture depending on which timeframe traders prefer to obsess over. Shorter-term averages are generally favorable, with the 10-day exponential moving average at $70,096 and the 10-day simple moving average at $69,439 both positioned below the current price. The 20-day EMA sits at $69,575 and the 20-day SMA at $68,665, reinforcing nearby structural support, while the 30-day EMA at $70,189 and the 30-day SMA at $68,327 also remain below the current price level.
However, longer-term averages still loom overhead, including the 50-day EMA at $72,741 and the 100-day EMA at $79,516, alongside the 200-day EMA at $87,821 and the 200-day SMA at $93,930. The result is a classic technical stalemate: short-term averages are supportive, longer-term averages remain overhead resistance, and price sits awkwardly between them like a trader who showed up early to a party that hasn’t quite started yet.
Bull Verdict:
If bitcoin maintains support above the $70,300–$70,500 zone, the technical structure favors a gradual push toward overhead resistance near $72,000 and $72,500. Momentum indicators such as the relative strength index ( RSI) holding above the midpoint and positive signals from moving average convergence divergence ( MACD) and the momentum indicator suggest underlying strength remains intact despite the current consolidation. A sustained move above $72,000 with expanding volume would reinforce the broader upward bias and reopen a path toward $75,000 and potentially the recent swing high near $74,075.
Bear Verdict:
Failure to maintain support near $70,500 would weaken the short-term structure and expose bitcoin to a deeper retracement toward the $70,000 level and possibly the $69,800 region identified as downside protection. The presence of several longer-term moving averages above price — including the 50-day exponential moving average at $72,741 and the 100-day and 200-day averages significantly higher — shows that overhead technical pressure still exists. A decisive break below support, accompanied by rising volume, would likely shift market sentiment from consolidation toward a corrective phase within the broader range.
FAQ 🔎
- What is bitcoin’s price on March 15, 2026?
Bitcoin traded around $71,754 on March 15, 2026, within a 24-hour range between $70,540 and $71,893.
- What are bitcoin’s key support and resistance levels right now?
Technical charts show support near $70,000–$70,500 and resistance around $72,000–$72,500.
- What do bitcoin’s technical indicators currently signal?
Most oscillators are neutral, while momentum and moving average convergence divergence ( MACD) lean positive, indicating mild upward pressure.
- Is bitcoin trending up or consolidating?
Across the daily, four-hour, and one-hour charts, bitcoin is consolidating in a tight range following its recent rally toward $74,000.
Related Articles
BTC 15-minute up 0.46%: spot trading volume expansion and derivatives long position buildup as two drivers
From 2026-04-15 19:30 to 19:45 (UTC), the BTC price fluctuated between 74,706.2 and 75,276.9 USDT. Within 15 minutes, the return reached +0.46%, and the range was 0.76%. Trading activity in the market for this window was active: spot trading volume rose 18% compared with the previous hour’s average. Volatility increased in the short term, and overall market attention improved.
The main drivers behind this abnormal move are the short-term amplification of spot market trading volume and the coordinated increase in long positions in the derivatives market. Derivatives futures open interest (Open Interest) during this period, on a month-over-month basis,
GateNews1h ago
BTC Breaks Through 75000 USDT
Gate News bot 消息,Gate 行情显示,BTC 突破 75000 USDT,现价 75000 USDT。
CryptoRadar2h ago
Tether Withdraws 951 BTC Worth $70.47M from Major CEX, Holds $7.2B in Bitcoin Reserves
Tether's BTC reserve address withdrew 951 BTC valued at $70.47 million, part of Q1 2026 purchases. It now holds 97,141 BTC worth around $7.2 billion, making it the fifth-largest BTC wallet with unrealized gains of $2.175 billion.
GateNews5h ago
BTC 15-minute drop of 0.62%: Exchange net inflows and liquidity depletion in sync trigger selling pressure
2026-04-15 14:30 to 2026-04-15 14:45 (UTC), the BTC price’s return over 15 minutes was -0.62%. The quoted range was 73,905.4 to 74,448.0 USDT, with a swing of 0.73%. Market volatility quickly intensified, drawing widespread attention from investors, and short-term trading activity became active.
The main driver behind this unusual movement was BTC net inflows to exchanges. On-chain data shows that during this period, about 6 BTC ($420,690) moved into exchanges, combined with the fact that the market’s overall order book depth has been continuing since February
GateNews6h ago
Bitcoin, Ethereum and Solana ETFs Record Positive Net Inflows on April 15
Gate News message, according to the April 15 update, Bitcoin ETFs recorded a single-day net inflow of 4,566 BTC (approximately $337.41 million) and a 7-day net inflow of 6,753 BTC (approximately $499.04 million). Ethereum ETFs saw a single-day net inflow of 23,405 ETH (approximately $54.37 million)
GateNews7h ago
BTC 15-minute drop of 0.70%: Increased ETF fund outflows and a coordinated sell-pressure trigger from derivatives position adjustments
From 2026-04-15 13:30 to 13:45 (UTC), the BTC price fluctuated within the range of 73,846.3 to 74,415.9 USDT. Within 15 minutes, the return recorded -0.70%, with an amplitude of 0.77%. During this period, market volatility intensified, trading volume and on-chain transfers heated up significantly, and market participants’ risk sensitivity increased.
The main driving force behind this unusual move was a sharp increase in ETF fund outflows. Data shows that on 2026-04-13, U.S. spot Bitcoin ETFs recorded net outflows of -231.7 million dollars, far above the one-week average
GateNews7h ago
