Post content & earn content mining yield
placeholder
gatefun
gatefun
- Altcoin Update: Ethereum and XRP Sellers Dominate Momentum:
Ethereum's price rejected the 200-day Exponential Moving Average (EMA) at $3,334 on Thursday, dropping nearly 5% by Monday, then retesting the 50-day EMA at $3,163. At the time of writing, Ethereum is trading lower, below the 50-day EMA.
If Ethereum's price (ETH) closes below the 50-day EMA at $3,163 on a daily basis, the decline could extend toward the daily support level at $3,017.
The Relative Strength Index (RSI) on the daily chart stands at 46, retreating from the neutral 50 level, indicating increasing bearish momentum. The MA
ETH-6,64%
XRP-4,92%
View Original
post-image
post-image
Before00zerovip
Cryptocurrency Today: Bitcoin, Ethereum, and XRP continue their price correction amid risk-off sentiment due to escalating geopolitical tensions.
Bitcoin (BTC), Ethereum (ETH), and Ripple (XRP) prices continued to decline on Tuesday as risk appetite waned amid rising geopolitical tensions over Greenland.
U.S. President Donald Trump posted on his Truth Social account on Tuesday that he spoke with NATO Secretary General (NATO) about Greenland. Trump explained that Greenland is "vital to national and global security," and confirmed plans to hold multi-party discussions at the upcoming World Economic Forum in Davos, Switzerland.
These developments have increased uncertainty and sparked risk aversion among traders, which does not bode well for risky assets.
Today’s Chart: Bitcoin Momentum Indicators Show Early Bearish Signals
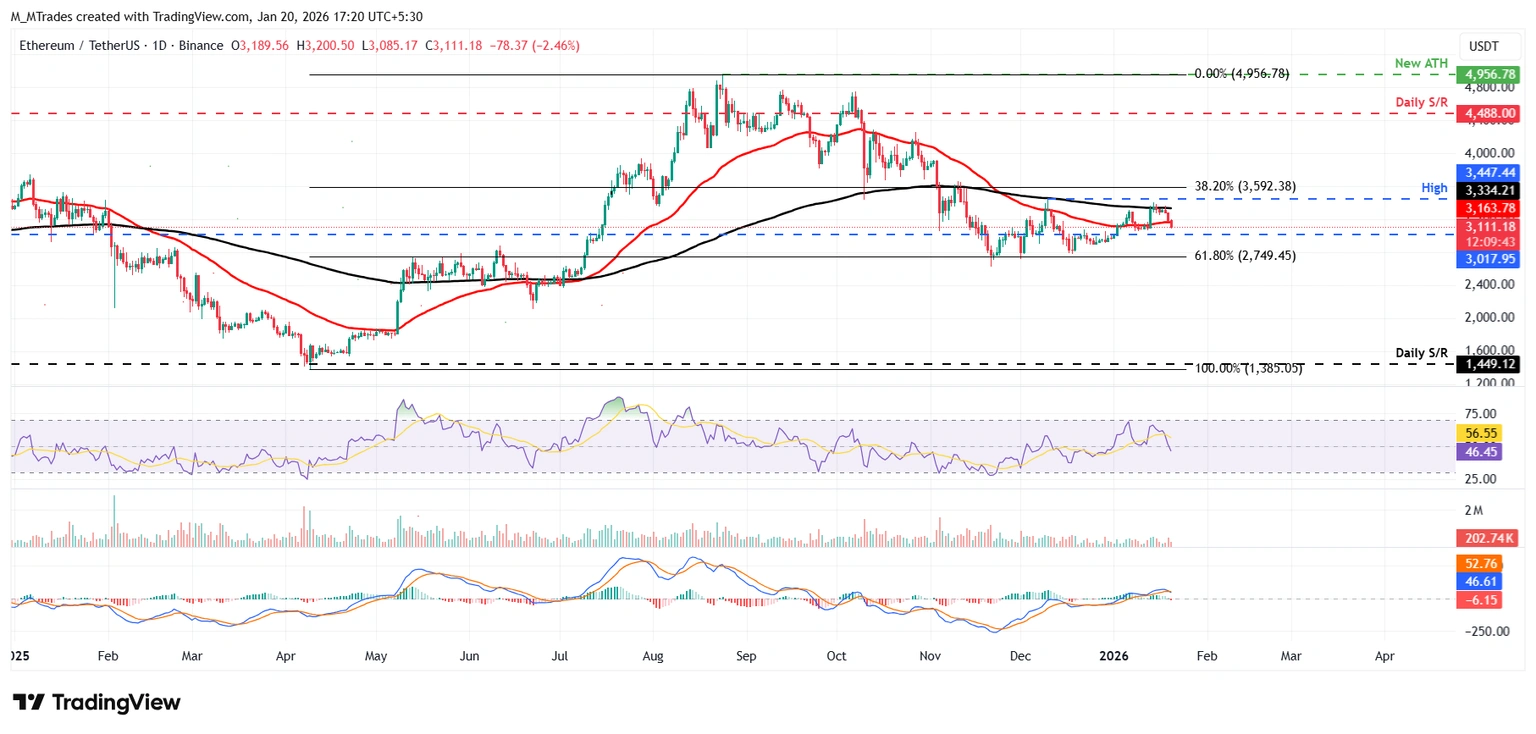
Bitcoin failed to hold above the 100-day Exponential Moving Average (EMA) at $95,787 on Thursday, dropping 3.35% over the next four days, and retesting the 50-day EMA at $92,348 on Monday. As of this report, Bitcoin is trading lower, below the 50-day EMA, approaching the next support level at $90,000.
If Bitcoin fails to find support around $90,000 (the previously broken upper consolidation zone), the decline could extend toward the lower consolidation boundary at $85,569, which coincides with the 78.60% Fibonacci retracement level (from the April low of $74,508 to the all-time high in October at $126,199).
The Relative Strength Index (RSI) on the daily chart is at 47, down from the neutral 50, indicating increasing bearish momentum. The Moving Average Convergence Divergence (MACD) also showed a bearish crossover on Tuesday, supporting the bearish outlook.
Conversely, if Bitcoin recovers, it could extend gains toward the 61.8% Fibonacci retracement level at $94,253.
Daily chart of BTC/USDT
repost-content-media
  • Reward
  • 1
  • Repost
  • Share
Before00zerovip:
Ethereum is trading in the red at around $3100, having fallen below the 50-day exponential moving average, keeping downside risks in place.
XRP price drops below the daily support level at $1.96, signaling the risk of a deeper correction.
#Showcase my futures returns#Gate每10分钟送1克黄金
View Original
post-image
[The user has shared his/her trading data. Go to the App to view more.]
  • Reward
  • Comment
  • Repost
  • Share
relative to how much $btc dumped, $umbra showed its strength, protected it's price and still trading strong. I think market will continue to chop for a few more days, sellers will panic, umbra will be trading up down for a little longer but then we're out free reaching the high sky clouds ☁️☂️
BTC-3,61%
post-image
  • Reward
  • Comment
  • Repost
  • Share
Muse
Muse
Muse
gatekol
Created By@交易员668
Subscription Progress
0.00%
MC:
$0
Create My Token
#晒出我的持仓收益# Protect the profit of the short position, make some money and then run, otherwise staying is too boring. Still keep the short, $FHE ‌long positions are just shorter.
FHE10,58%
View Original
post-image
  • Reward
  • 2
  • Repost
  • Share
YouyouOraclevip:
Hosting a live stream to teach in a couple of days
View More
$ETH The 2977 mentioned around 10 PM is just right, not偏不倚 just right #Gate每10分钟送1克黄金
ETH-6,64%
View Original
post-image
post-image
  • Reward
  • 12
  • Repost
  • Share
GateUser-8274da45vip:
It's still early.
View More
hi i love you
(going back to pink)
post-image
  • Reward
  • Comment
  • Repost
  • Share
#GoldandSilverHitNewHighs
🔹Silver prices, following a massive surge of approximately 150% in 2025, reached record highs in 2026, surpassing the $94-95 per ounce range and hitting an all-time high of around $96. This rally is driven by supply-demand imbalances (an annual deficit of 150-200 million ounces), explosive industrial demand in green energy and electronics sectors (particularly solar panels and AI technologies), geopolitical tensions, a weakening US dollar, central banks seeking safe havens, and physical stock demand from countries like China and India – making silver a more volatile
SLVON-1,31%
post-image
  • Reward
  • 9
  • Repost
  • Share
Discoveryvip:
DYOR 🤓
View More
Viewing the Top Market Coins Spot Chart and comparing them
gate liveLIVE
1
  • Reward
  • Comment
  • Repost
  • Share
⚠️⚠️ JUST IN: The gold market has expanded by $740 billion in market value within the last 18 hours.
post-image
  • Reward
  • Comment
  • Repost
  • Share
My Gate 2025 Year-End Summary is here! See how I performed this year.
Click the link to view your exclusive #2025GateYearEndSummary and claim a 20 USDT Position Voucher. https://www.gate.com/competition/your-year-in-review-2025?ref=AwBFBl5c&ref_type=126&shareUid=VlVGXF1eAwIO0O0O
post-image
  • Reward
  • 8
  • Repost
  • Share
User_anyvip:
Happy New Year! 🤑
View More
Peter Schiff says a US financial crisis worse than 2008 is coming this year.
Do you think he’s right?
post-image
post-image
  • Reward
  • Comment
  • Repost
  • Share
let share crypto idea
post-image
  • Reward
  • Comment
  • Repost
  • Share
I decided to enter the trade with a very conservative stop-loss.
  • Reward
  • Comment
  • Repost
  • Share
GCOIN
GCOIN
Gate Coin
gatefun
Created By@0xd1b5...a733
Listing Progress
0.00%
MC:
$3.35K
Create My Token
$FUN is trending lower after failing to hold the 0.074 supply zone, transitioning into a controlled downtrend. Price is now hovering near 0.0665, which is a critical support level. Holding this zone may allow for a short-term relief bounce; failure would likely expose FUN to 0.062 and potentially 0.058. Resistance is layered at 0.0695–0.0705, followed by a stronger ceiling near 0.074. A reclaim above 0.0705 would be required to neutralize downside pressure and open the door for a move back toward 0.078. Until that happens, structure favors sellers on rallies, with upside moves considered corre
FUN-15,77%
post-image
  • Reward
  • Comment
  • Repost
  • Share
Apart from silver and gold rising📈
Over 90% of US stocks
are all in the green
View Original
post-image
post-image
  • Reward
  • Comment
  • Repost
  • Share
Decentralized doesn’t mean disorganized.
post-image
  • Reward
  • 1
  • Repost
  • Share
ybaservip:
Happy New Year! 🤑
🚨 MASTERCLASS ON HOW TO GENERATE PASSIVE INCOME WITH CRYPTO.
Discover our exact strategy that we use to generate extra income from scratch. Available for a limited time:
View Original
post-image
  • Reward
  • Comment
  • Repost
  • Share
JUST IN: 🇺🇸 Over $1.3 trillion wiped out from the US stock market today.
post-image
  • Reward
  • Comment
  • Repost
  • Share
Imagine... $XAir
When you truly understand and believe in what you're holding. Making money becomes lot easier.
Stay strong in your convictions.
post-image
  • Reward
  • Comment
  • Repost
  • Share
Load More
Trade Crypto Anywhere Anytime
qrCode
Scan to download Gate App
Community
  • 简体中文
  • English
  • Tiếng Việt
  • 繁體中文
  • Español
  • Русский
  • Français (Afrique)
  • Português (Portugal)
  • Bahasa Indonesia
  • 日本語
  • بالعربية
  • Українська
  • Português (Brasil)