WLFI rebounded 3% on Tuesday above $0.1300, ATOM gained 8% over three days, and JUP continued to rise by 1%, with all three remaining below key moving averages. RSI is below 50 for all, and MACD is contracting in negative territory, indicating weakening bearish momentum but no reversal. Key supports are WLFI at $0.1215, ATOM at $1.832, and JUP at $0.1695.
WLFI Rebounded from Key Support but Trend Remains Fragile
(Source: Trading View)
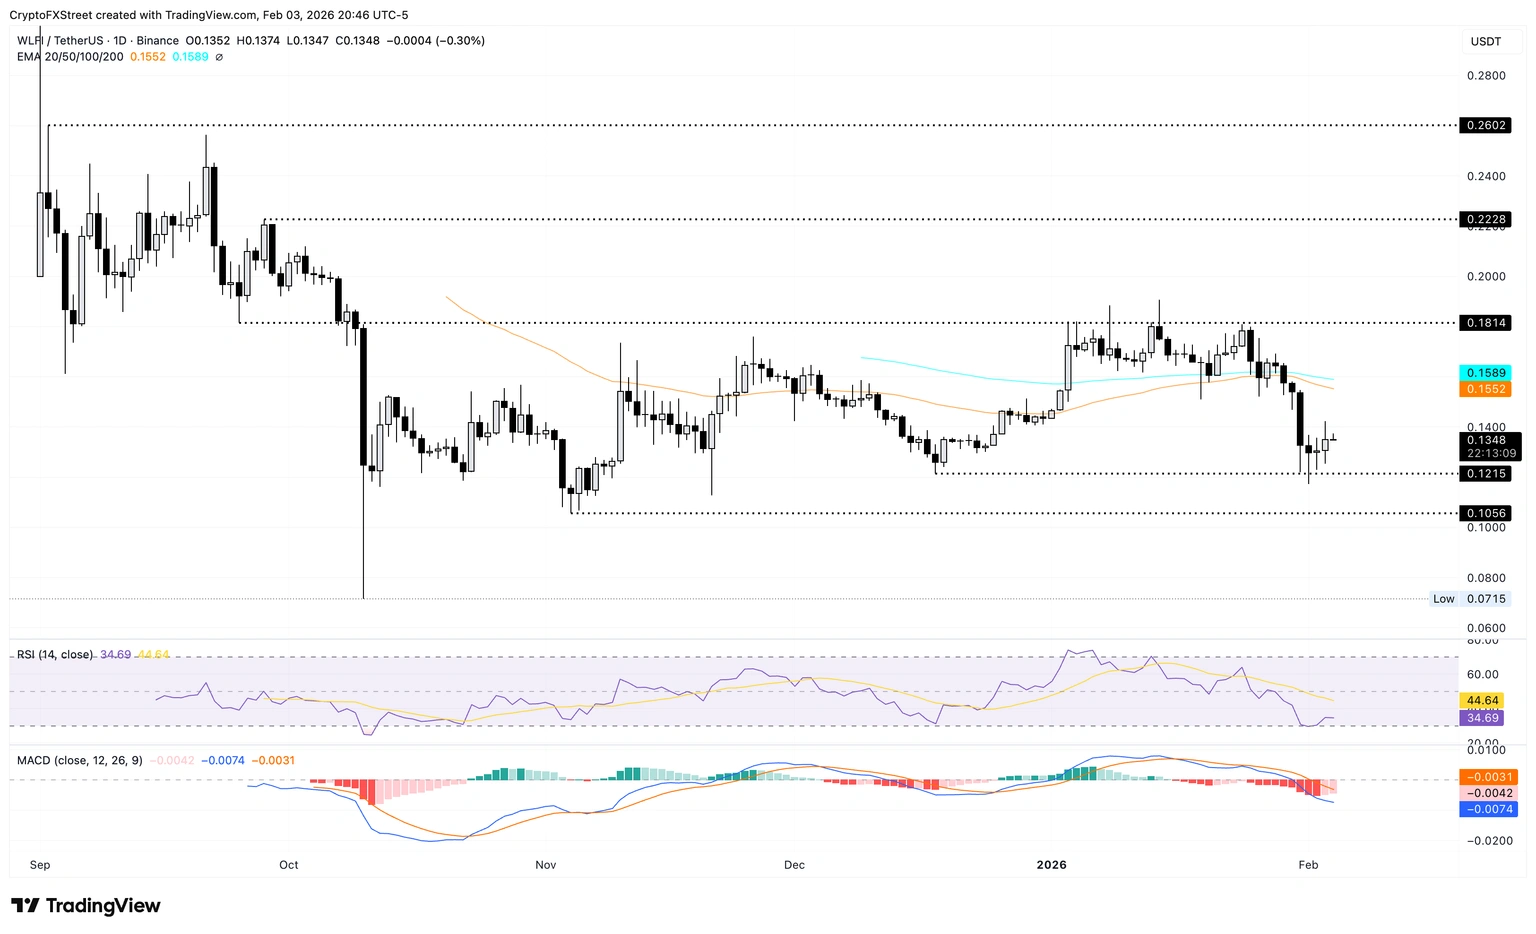
As of Wednesday’s report, World Liberty Financial (WLFI) stock price stayed above $0.1300, maintaining a 3% increase from the previous day. However, since WLFI’s price remains below the 50-day moving average of $0.1552 and the 200-day moving average of $0.1589 further consolidates its overall downtrend, the upward trend is still fragile. WLFI’s continued recovery may face resistance from these moving averages.
As a token under the Trump family’s decentralized finance platform, WLFI’s price movement is highly influenced by political news and Trump family developments. Tuesday’s 3% rebound could be related to a pro-crypto policy statement from the Trump administration or progress in World Liberty Financial’s business. However, technically, this appears more like a technical rebound after overselling rather than the start of a trend reversal.
With the histogram shrinking, the MACD and signal line are slowing their descent below zero, indicating weakening bearish pressure. The RSI is at 34, rebounding from oversold territory but still below the neutral level of 50. This technical setup suggests that while selling pressure is easing, buying strength is not yet sufficient to reverse the trend.
Looking downward, if WLFI breaks below the support at $0.1215 (which coincides with the low on December 18), there is a risk of further decline toward the S1 pivot at $0.1062. The $0.1215 level is the most critical recent defense line; holding it could extend the rebound momentum, while breaking it could trigger a new wave of selling. For investors holding WLFI, this level is a key stop-loss reference point.
ATOM Gains 8% Over Three Days but Faces Clear Moving Average Resistance
(Source: Trading View)
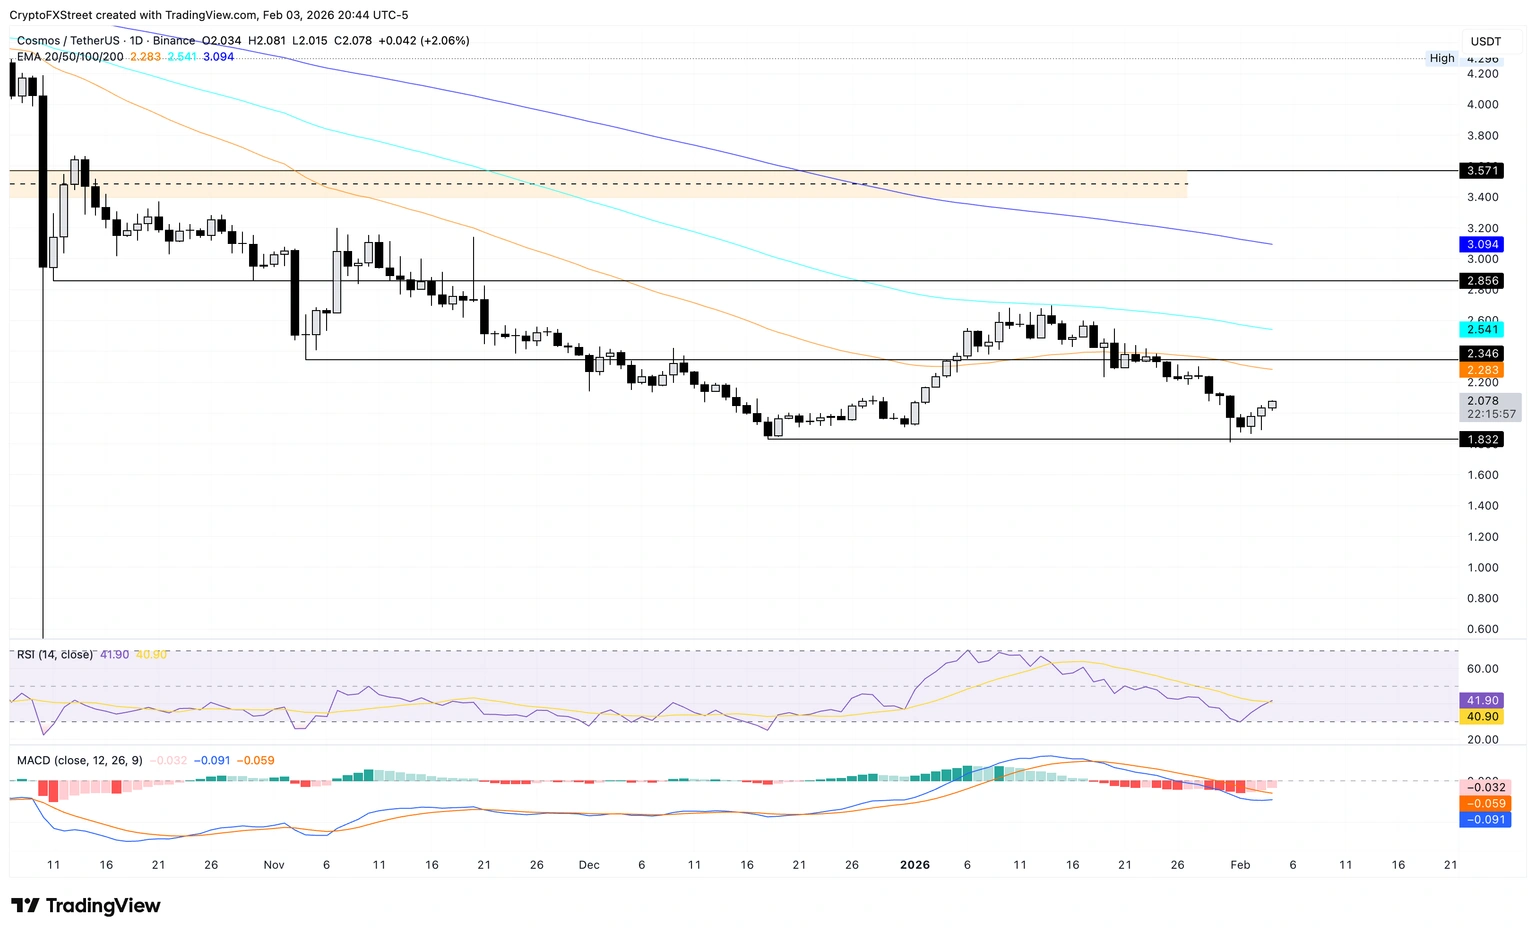
As of Wednesday’s report, ATOM’s price increased by 2%, marking its third consecutive day of strength with a total gain of over 8%. However, ATOM’s price remains below the 50-day, 100-day, and 200-day moving averages, at $2.283, $2.541, and $3.094 respectively. The 50-day MA is below the 100-day MA, further reinforcing the bearish trend, with this “death cross” indicating a broadly negative medium- to long-term outlook.
As a long-established blockchain project, Cosmos’s ATOM token has historically lagged behind the market average. The 8% rebound on Wednesday has technical significance, suggesting ATOM may be forming a phase bottom after a prolonged decline. However, confirming a trend reversal requires the price to break above and hold the 50-day moving average at $2.283; otherwise, it remains a technical rebound within a bear market.
If the daily close exceeds the $2.283 level, it could push the price toward the 100-day MA at $2.541. This represents roughly a 20% upside from current levels and could be attractive for short-term traders. Otherwise, downward pressure persists, and the moving averages will continue to act as resistance, limiting the overall trend and capping any rebound, with prices likely oscillating between current levels and the December 18 low of $1.832.
The MACD line remains below the signal line in negative territory, with the histogram shrinking toward zero, indicating weakening bearish momentum. The RSI is at 42, showing a generally bearish market tone that has begun to turn upward, hinting at stabilizing momentum but no reversal yet. From a downside perspective, if upward resistance fails, ATOM could retest the December 18 low at $1.832.
Key Technical Levels for ATOM
Current Price: Around $2.00
Key Resistance: 50-day EMA at $2.283, 100-day EMA at $2.541, 200-day EMA at $3.094
Key Support: $1.832 (December 18 low)
Technical Indicators: RSI 42 (bearish but improving), MACD in negative territory with shrinking histogram
JUP Continues Uptrend but 50-day EMA Acts as Barrier
(Source: Trading View)
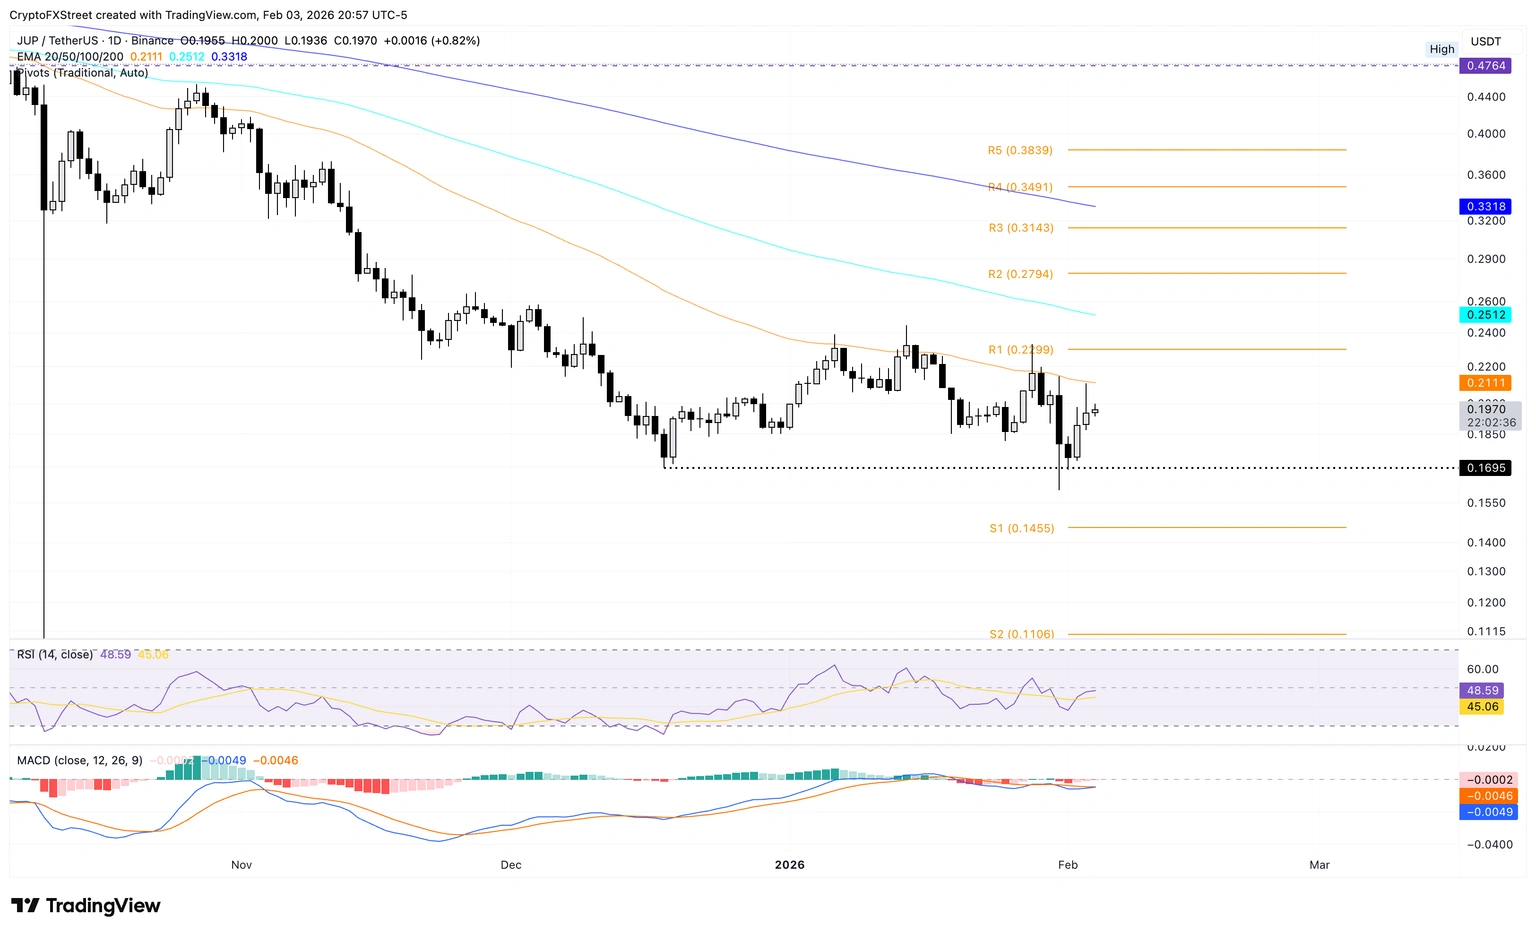
JUP token is currently trading below the 50-day exponential moving average (EMA) at $0.2111, which limits its rebound potential and reinforces a bearish bias. As of the report, JUP rose nearly 1% on Wednesday, continuing a 3% gain from the previous day, with a two-day total increase of about 4%. As a leading DEX aggregator in the Solana ecosystem, JUP’s performance is often correlated with the overall activity within Solana.
If the daily close exceeds the $0.2111 level, downward pressure may ease, and a rebound toward the R1 pivot at $0.2299 could occur. Conversely, failure to regain this level would keep downside risks high. The $0.2111 mark is the most critical technical threshold for JUP; breaking above it opens upside space, while failure could lead to testing lower supports.
The MACD line remains below the zero line and signal line, with shallow negative bars shrinking, indicating weakening bearish pressure. The RSI is at 48, rising slightly, suggesting momentum is stabilizing. The RSI at 48 is very delicate; it’s neither oversold nor overbought, positioned in a neutral to slightly bearish zone. This state often precedes a trend reversal or consolidation, with the next move depending on external catalysts.
In a pullback, the key support for JUP remains at the December 18 low of $0.1695. If the price tests this level and finds support with increased volume, it could confirm a bottom. Conversely, a break below $0.1695 could lead to deeper correction, with the next support around $0.15.
All three tokens share the common feature of rebounding from their December 18 lows, suggesting that day may be the phase bottom of this decline. However, confirming a true bottom requires sustained breakout above key moving average resistance levels, along with volume and RSI improvements. The current rebound appears more like a technical correction after overselling; whether it develops into a trend reversal remains to be seen.
Disclaimer: The information on this page may come from third parties and does not represent the views or opinions of Gate. The content displayed on this page is for reference only and does not constitute any financial, investment, or legal advice. Gate does not guarantee the accuracy or completeness of the information and shall not be liable for any losses arising from the use of this information. Virtual asset investments carry high risks and are subject to significant price volatility. You may lose all of your invested principal. Please fully understand the relevant risks and make prudent decisions based on your own financial situation and risk tolerance. For details, please refer to
Disclaimer.
Related Articles
BTC 15-minute decline of 0.60%: key support broken, combined with leverage deleveraging triggering short-term selling pressure
2026-03-11 17:30 to 2026-03-11 17:45 (UTC), BTC's 15-minute return decreased by -0.60%, with prices fluctuating between 70515.2 and 71317.0 USDT, with an amplitude of 1.13%. Trading volume significantly increased compared to the previous period, with selling pressure dominating, short-term market volatility intensifying, and market attention heating up.
The main driver of this anomaly was BTC losing the key support zone at $68,000-$68,200, triggering algorithmic trading sell-offs and stop-loss orders to be released in concentration, leading to a short-term decline. Meanwhile,
GateNews9m ago
Polkadot Holds $1.46 Support as Descending Channel Caps Upside Near $1.53
The heaviest resistance is at the 4-hour chart where DOT trades within a downward channel and resistance levels are formed near the levels of $1.50-$1.53.
The nearest support is at $1.46 and a more profound zone of demand is at the range of $1.38 to $1.40.
Even with a 1.5 price drop, DOT
CryptoNewsLand21m ago
SOL Consolidates Near $84 While Chart Highlights Possible $45 Demand Zone
Solana (SOL) trades at $83.87 within a range defined by $81.03 support and $84.43 resistance, showing consolidation below a $90 supply zone. There is a broader demand area near $45, indicating potential downward movement before recovery.
CryptoNewsLand26m ago
XRP Eyes $3 As Bollinger Band Squeezes, Setting Stage for Massive 217% Price Spike
In the volatile cryptocurrency landscape, the XRP coin is drawing investor interest for its ability to spur liquidity-driven moves. Today, market analyst Ali Martinez examined the latest chart trajectory of XRP and disclosed a Bollinger Band squeeze that suggests that the market is building for a
BlockChainReporter52m ago
PEPE Stalls at $0.053354 While Oscillators Drift Below 40 Inside Tight Trading Band
PEPE fell to 2.4 per cent to trade at a price of $0.053354 but above the level of support in the vicinity of $0.053325.
Momentum indicators are tight and oscillator values are close to 39.47 and 36.73 and MACD is close to zero line.
The intra-day range of $0.053325 to $0.053473 is still r
CryptoNewsLand1h ago
'Black Swan' Author Nassim Taleb Believes Elon Musk's X Money is 'Much Smarter' Than Bitcoin - U.Today
Elon Musk's X Money will enter early access in April, with Nassim Taleb praising it as a superior alternative to Bitcoin. He argues it promotes competition in currency issuance, functional daily use, and is backed by a robust infrastructure, unlike volatile cryptocurrencies.
UToday2h ago