
The SUI price is back on traders’ radars after holding a key higher-timeframe support zone and bouncing sharply from recent lows. According to CryptoPatel, the weekly chart is starting to show signs of re-accumulation after a deep correction from the 2024 highs.
While price has already moved higher, the broader setup indicates this could be the early phase of a larger trend shift. At the time of the analysis, the SUI price was hovering around the $1.80 area, already up roughly 45% from the recent low.
- What the SUI Chart Is Telling Us
- Structure and Momentum Check
- Where SUI Price Could Head Next
What the SUI Chart Is Telling Us
On the weekly chart shared by Patel, the SUI price completed a clear liquidity sweep below previous lows. That move flushed out weaker hands before price quickly reversed, a pattern that often points to smarter positioning behind the scenes. The rebound started inside a strong weekly bullish order block between $1.30 and $1.50, a zone that price respected cleanly.
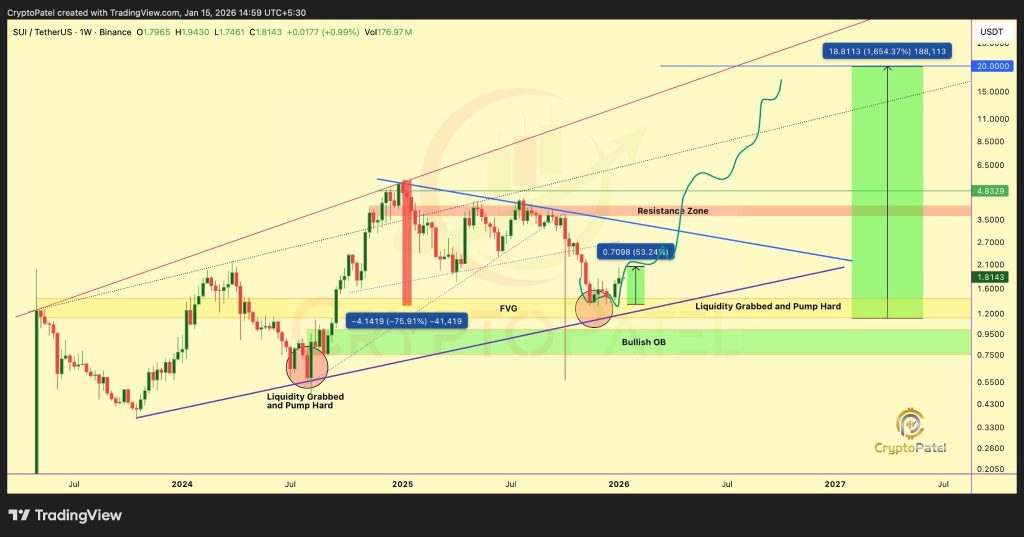
Source: X/@CryptoPatel
What makes this area stand out even more is that it lines up with a fair value gap. That overlap created a strong demand zone, and once price tapped into it, buyers stepped in fast. Since then, the SUI price has been pushing higher, supporting the idea that the market is moving from distribution into re-accumulation.
SUI Short-Term Outlook: Where Could Price Be Headed Next?_**
Structure and Momentum Check
Zooming out, it is clear that SUI is still trading in a rising channel. Despite the recent pullback from 2024 highs, a look at a larger picture indicates that a rising channel is still in play. Instead of a breakdown, a correction in price started right where it mattered.
The nearly 50% bounce from the demand zone shows that downside momentum has eased. As long as the SUI price holds above $1.20 on a weekly close, the bullish structure stays in place. That level now acts as the line in the sand for the bigger picture.
Where SUI Price Could Head Next
CryptoPatel points to upside targets at $5, $10, and even $20, based on the channel structure and historical expansion levels. These moves would not happen in a straight line, but the setup suggests higher prices remain possible if accumulation continues.
For now, the attention is on whether the SUI price can continue to make higher lows and remain above support levels. If so, a correction would only mean a continuation of a correction, and all possibilities are very much alive.
Disclaimer: The information on this page may come from third parties and does not represent the views or opinions of Gate. The content displayed on this page is for reference only and does not constitute any financial, investment, or legal advice. Gate does not guarantee the accuracy or completeness of the information and shall not be liable for any losses arising from the use of this information. Virtual asset investments carry high risks and are subject to significant price volatility. You may lose all of your invested principal. Please fully understand the relevant risks and make prudent decisions based on your own financial situation and risk tolerance. For details, please refer to
Disclaimer.
Related Articles
XRP Today's News: Rare Bottom Signal Appears, Technical Analysis Suggests Price Reversal Approaching
According to Glassnode data, XRP exhibits two major indicator signals indicating that the price is below its fair value, and the realized profit/loss ratio is approaching 1.0, which historically suggests a possible rebound. Additionally, XRP is consolidating within a symmetrical triangle pattern, with a key resistance at $1.50 and support at $1.30, as the market is about to experience a breakout in a specific direction.
MarketWhisper8m ago
VIA Soars 23.45% in Minutes — Traders React to Whale Activity
VIA's price surged by 23.45% in five minutes, currently trading at $0.002026. The rise is linked to increased whale activity and broader market trends, prompting traders to monitor key resistance and support levels.
Coinfomania17m ago
CryptoQuant: Ethereum Adoption Paradox Deteriorates, Price May Fall to $1500
Ethereum faces an "adoption paradox," where network activity reaches record highs but ETH price has fallen sharply, showing a divergence between the two. Analysis points out that current network activity growth primarily comes from automated contracts like DeFi, rather than genuine user demand, which intensifies selling pressure. If the bear market continues into 2026, ETH could fall to $1,500. Attention should be paid to changes in capital inflows and exchange inflows to determine whether ETH will emerge from the bear market.
MarketWhisper19m ago
Crypto market rebounds this morning, BTC touches $72,000, funding rates return to neutral
The crypto market rebounded on March 13, with Bitcoin recovering to 72,000 USD and Ethereum recovering to 2148 USD. Funding rates on major exchanges returned to neutral levels, indicating that bearish sentiment has eased. The funding rate is a mechanism that adjusts the relationship between contract prices and asset prices.
GateNews42m ago
Cardano Price Near Key Pivot as Macro Liquidity Signals Shift
Key Insights
Analyst Dan Gambardello links Cardano’s monthly RSI reset and macro liquidity cycles to conditions that previously preceded ADA’s explosive 2020–2021 rally.
ADA trades near $0.26 while the $0.288 moving average forms resistance, and the $0.24 to $0.25 zone continues acting as
CryptoFrontNews59m ago