
**Date: **Mon, Jan 05, 2026 | 10:58 AM GMT
As 2026 kicks off, the broader cryptocurrency market is showing renewed stability. Both Bitcoin (BTC) and Ethereum (ETH) are up more than 6% on the week, and improving sentiment is gradually spreading across major altcoins — including the DeFi heavyweight Aave (AAVE).
AAVE has gained over 8% on a weekly basis, but the more important story is unfolding beneath the surface. While short-term strength is encouraging, the bigger development lies in the broader market structure forming on the higher timeframe. Recent price action suggests a meaningful shift in behavior — one that could mark the early stages of a bullish continuation if key technical levels hold.
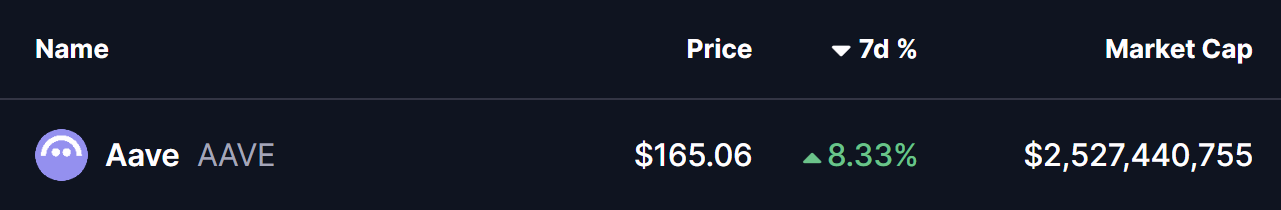
Source: Coinmarketcap
Symmetrical Triangle in Play
On the weekly chart, **AAVE **continues to trade within a symmetrical triangle, a neutral yet powerful pattern that often precedes a major volatility expansion once price approaches its apex.
The structure began forming after AAVE’s strong rally earlier in 2025. However, in August 2025, price faced firm rejection near the triangle’s descending resistance around $385, triggering a sharp corrective move. That pullback resulted in a 62% decline, eventually driving price down toward the triangle’s ascending support trendline near $143.53 last month.
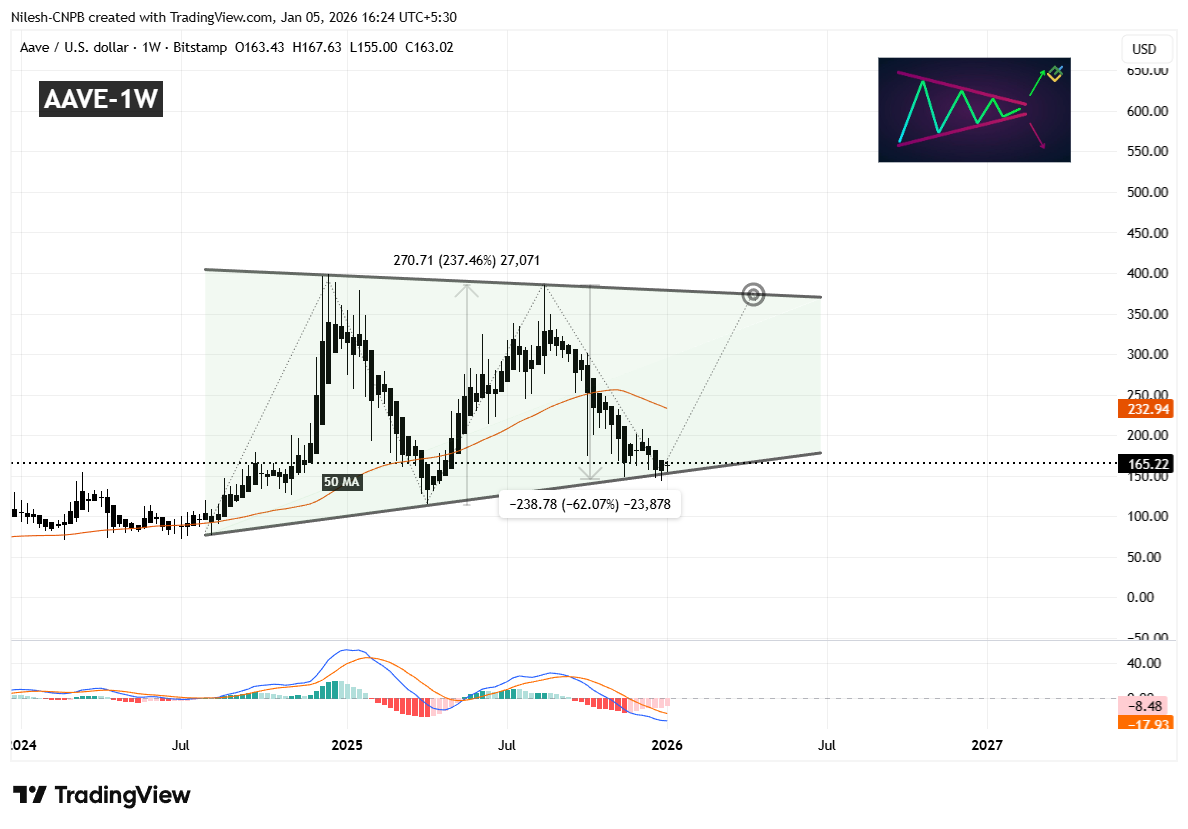
Aave (AAVE) Weekly Chart/Coinsprobe (Source: Tradingview)
Crucially, buyers once again stepped in to defend this long-term support zone. The successful reaction from this level has pushed AAVE back toward the $164 region, signaling renewed buying interest. Notably, this rebound is occurring as the MACD shows early signs of stabilization — a setup that closely resembles conditions seen before AAVE’s previous 237% rally in April 2025.
The next major technical hurdle lies at the 50-week moving average, currently positioned near $232.94. This level has acted as dynamic resistance during the recent decline, and reclaiming it would mark a meaningful shift in medium-term momentum.
What’s Next for AAVE?
If the pattern continues to develop as expected, AAVE could soon attempt a sustained move above the 50-week MA. A confirmed reclaim of this level — followed by acceptance above it — would strengthen the bullish case and increase the probability of a move toward the upper boundary of the triangle near $375.
Such a move would imply a potential upside of roughly 125% from current levels, assuming broader market conditions remain supportive and momentum continues to build.
Until then, patience remains key. Holding above the ascending support trendline is essential for preserving the bullish structure. Any sustained breakdown below this level would weaken the setup and delay the breakout thesis.
For now, the chart suggests AAVE is at a critical inflection point, where compression within the triangle could soon give way to a decisive move — with the direction likely defined by how price behaves around the 50-week moving average.
Disclaimer: The views and analysis presented in this article are for informational purposes only and reflect the author’s perspective, not financial advice. Technical patterns and indicators discussed are subject to market volatility and may or may not yield the anticipated results. Investors are advised to exercise caution, conduct independent research, and make decisions aligned with their individual risk tolerance.
About Author: Nilesh Hembade is the Founder and Lead Author of Coinsprobe, with over 5 years of experience in the cryptocurrency and blockchain industry. Since launching Coinsprobe in 2023, he has been providing daily, research-driven insights through in-depth market analysis, on-chain data, and technical research.
Disclaimer: The information on this page may come from third parties and does not represent the views or opinions of Gate. The content displayed on this page is for reference only and does not constitute any financial, investment, or legal advice. Gate does not guarantee the accuracy or completeness of the information and shall not be liable for any losses arising from the use of this information. Virtual asset investments carry high risks and are subject to significant price volatility. You may lose all of your invested principal. Please fully understand the relevant risks and make prudent decisions based on your own financial situation and risk tolerance. For details, please refer to
Disclaimer.
Related Articles
Retail investors drive widespread bitcoin selling as prices fall
Glassnode's Accumulation Trend Score indicates widespread selling led by retail investors as Bitcoin dips below $67,000, primarily from those holding under 10 BTC, while larger entities hold back, showing neutral behavior.
CoinDeskJust Now
Bitcoin Undergoes Short-Term Pressure As Market Faces Fear
Bitcoin ($BTC) faces a 2.67% drop in the last 24 hours amid market fear, despite a 5.20% monthly gain. With a current price of $68,703.11, traders are closely monitoring for potential shifts in the near term.
BlockChainReporter1m ago
BTC Price Plunges to 3-Week Low as Analysts Map Out Next Downside Targets
The first breakdown to under $68,000 seemed as just the beginning for bitcoin’s Friday correction, which just worsened with another dip to a fresh 3-week low.
Most altcoins have followed suit, which has harmed over-leveraged traders, with more than 120,000 such participants being wrecked in the
CryptoPotato1m ago
All Zeroes? XRP Ledger Posts Critically Low Values - U.Today
XRP's market is weak
Price and network falling behind
Weak technical structure and dwindling on-chain activity are coming together for XRP, and neither is currently providing any cause for optimism. XRP is still trending lower on the chart, staying capped below the 50 EMA and failing to recover i
UToday20m ago
Altcoins Are Currently Building Towards a Most Bullish Cup and Handle Pattern Formation
Altcoins are currently building towards a most bullish pattern.
Analysts marks a huge cup and handle formation on the altcoin price chart.
Chances for altseason arrival grows stronger.
The crypto market continues to move sideways, and today it is trading on the lower spectrum. To
CryptoNewsLand49m ago
Fractal data: The price of TAO on Bittensor could drop sharply by 40% within five weeks.
Bittensor (TAO) recently surged 160%, but signs of weakness are appearing with a golden cross formation, historically leading to significant pullbacks. Past instances suggest a potential 40% decline in the coming weeks, amidst overbought conditions and macroeconomic pressures. Despite increased discussions surrounding TAO, investor sentiment remains cautious.
TapChiBitcoin1h ago
