Michaël van de Poppe called this an interesting chart, and that description fits perfectly. The altcoin market cap, excluding Bitcoin and Ethereum, is sitting right on a level that really matters.
The market isn’t crashing, and it isn’t collapsing either. We’re seeing a pause, and those pauses do tend to shape what comes next. The vital thing to note, however, is that the uptrend remains intact, provided this support holds.
Best Altcoins to Watch Right Now: PEPE, ETH, and More_**
- What the Weekly Chart Is Telling Us
- Why the Rejection at the 21-Week MA Is Normal
- What Comes Next for Altcoins
What the Weekly Chart Is Telling Us
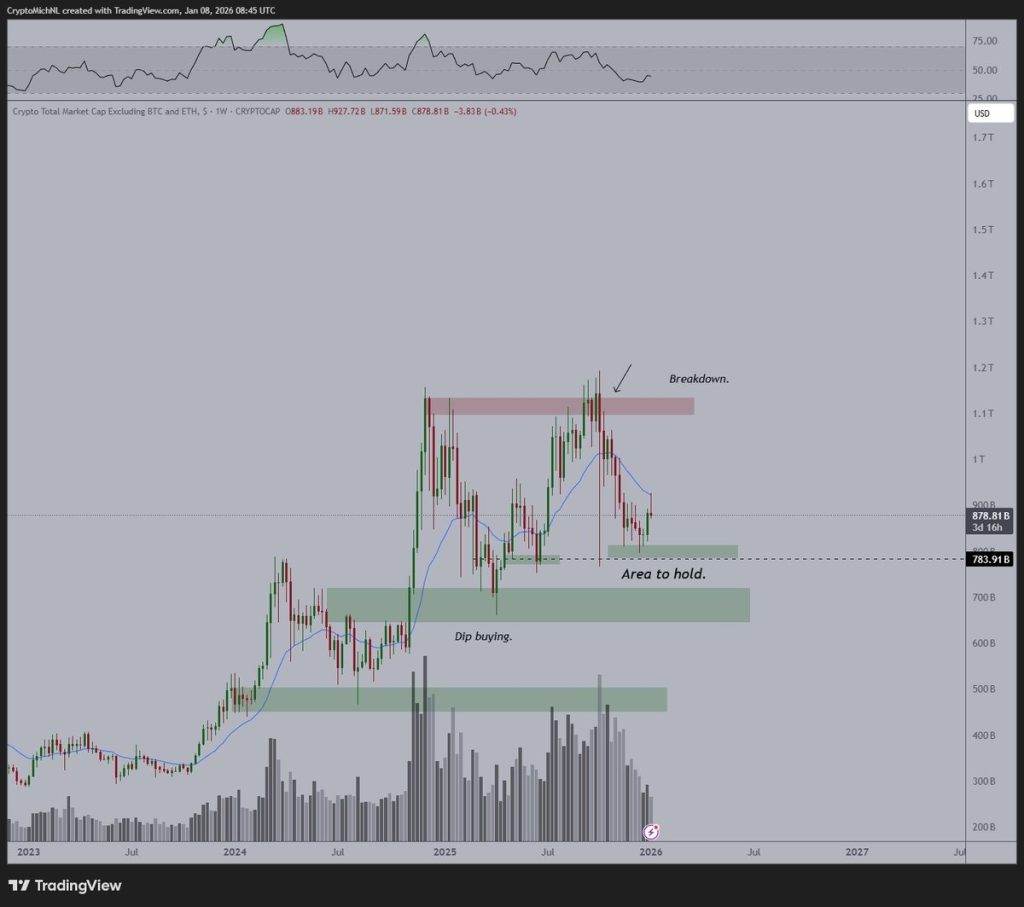
On the weekly chart shared by Michaël, the altcoin market cap had a strong run through 2024 and into early 2025. After that, momentum slowed and price pulled back into a well-defined support zone. That zone, marked as the “area to hold,” is where the market is currently hovering, around the $878B level.
Source: X/@CryptoMitchNL
Just below that sits the more critical line near $784B. This is the level that really matters on a weekly close. As long as the market stays above it, the structure remains constructive. This kind of pullback is actually typical in an uptrend, where price pushes higher, pulls back to demand, and then looks for the next attempt higher.
Bitcoin, Solana, XRP, Other Altcoins Are Waking Up Again: 5 Reasons the Rally Is Not Over_**
Why the Rejection at the 21-Week MA Is Normal
The first bounce off support ran straight into the weekly 21 moving average. The price got rejected there and pulled back again, which might feel discouraging if you were expecting a fast continuation. But in reality, this is fairly normal behavior.
When markets fall below a key moving average, they often need time to build strength before they can reclaim it. That rejection also lines up with a previous supply zone, which explains why price stalled there. Nothing about this move looks random.
What Comes Next for Altcoins
If the $784B area continues to hold, the chart leaves room for more sideways action before another attempt higher.
The next major test would be a reclaim of the 21-week moving average and a move back toward the $1T area, which is where the earlier breakdown started.
If support does fail, the next meaningful demand zone sits lower, roughly between $650B and $700B. That zone acted as a dip-buying area before, so it is the next place where buyers would likely step in.
For now, the chart supports van de Poppe’s main takeaway. It is not a breakout yet, but as long as this support holds, the bigger trend for altcoins still points higher.
Top Analyst Goes All In on Kaspa (KAS): Reveals Why It Beats Most Altcoins_**
Disclaimer: The information on this page may come from third parties and does not represent the views or opinions of Gate. The content displayed on this page is for reference only and does not constitute any financial, investment, or legal advice. Gate does not guarantee the accuracy or completeness of the information and shall not be liable for any losses arising from the use of this information. Virtual asset investments carry high risks and are subject to significant price volatility. You may lose all of your invested principal. Please fully understand the relevant risks and make prudent decisions based on your own financial situation and risk tolerance. For details, please refer to
Disclaimer.
Related Articles
Ethereum (ETH) on the Edge: Critical Level Stands Between New Bull Run and a Major Crash
While the second-largest cryptocurrency has registered a significant rebound over the past month, it remains at risk of plummeting to drastically low levels during this cycle.
On the other hand, some important indicators suggest that the worst might be over and the price could be gearing up for a m
CryptoPotato54m ago
Dogecoin (DOGE) Mini Cycles Are Repeating – Here’s Where the Price Could Go Next
DOGE's price is currently in a critical phase, trapped in a descending triangle, testing support at $0.0886. Analysts suggest potential for either a bounce toward $0.1050 or a drop to $0.0820. The path ahead depends on reclaiming higher ranges to continue its cyclical pattern of accumulation and breakout.
CaptainAltcoin1h ago
Bittensor (TAO) Is Up 140% in 6 Weeks, But Data Shows Retail Is Missing the Big AI Rally
Bittensor has recorded a 140% price increase over the past six weeks, including a 105% rise since March 8.
The latest price action has pushed it to the 26th-largest cryptocurrency by market capitalization, according to new data from Santiment.
AI Tokens Heat Up
-----------------
The rally comes a
CryptoPotato2h ago
Bitcoin Historical Data Suggests April Could Break the Current Q-1 Market Stagnation
The cryptocurrency market is nearing the end of the first quarter of 2026 and is in a unique position of stability. Unlike the past where BTC experienced extreme price swings; in March BTC has been flat and rather like what transpired in this same month one year ago, with analyst Daan Crypto
BlockChainReporter2h ago
Zcash Rally Gains Strength as Privacy Demand and ZODL Funding Lift ZEC
Key Insights:
The Zcash price rose above $235 with strong volumes, reflecting sustained institutional participation and signaling broader market confidence in privacy-focused digital assets.
The $25 million ZODL funding supports protocol upgrades, wallet growth, and shielded adoption,
CryptoNewsLand3h ago
Bittensor TAO Jumps 17% as Market Momentum Strengthens
Key Insights:
Bittensor surged 17% in one day, with strong weekly and monthly gains supported by broader crypto stability and rising investor participation.
Institutional access expanded through new exchange products while Grayscale’s trust premium signaled sustained demand for
CryptoNewsLand3h ago
