Kaspa entered 2026 without much noise, yet the first few days of the year have already hinted at a possible shift. After a largely disappointing 2025 where Kaspa price struggled to hold momentum, KAS has opened the new year with a modest rebound. Roughly 20% upside since January began has pushed the token back into focus, especially as the broader crypto market starts to lean bullish.
This early move does not signal a trend change on its own, though it does show buyers stepping in sooner than many expected. With January still in its opening week, Kaspa price now sits at an important technical crossroads.
- Kaspa Price Action Shows Early Strength After A Tough 2025
- Kaspa Still Trades Inside A Descending Channel From 2024
- Kaspa Support Near $0.037 Helped Trigger The Current Bounce
- Super Bullish Kaspa Price Scenario Points Toward $0.08
- Bearish Kaspa Price Scenario Brings Focus Back To $0.03 Support
Kaspa Price Action Shows Early Strength After A Tough 2025
Kaspa price spent much of 2025 underperforming expectations. Repeated attempts to build sustained momentum failed, leaving KAS trapped in a prolonged cooling phase. That weakness followed the strong rally seen during mid 2024, when Kaspa reached a new all time high before momentum faded.
January brought a different tone. Price climbed roughly 20% from the start of the year, reflecting improving sentiment across the crypto market rather than a sudden shift in Kaspa fundamentals. Strength across majors often spills into high beta assets like KAS, creating short term upside even when larger trends remain undecided.
This early move matters because it shows buyers stepping in again after months of hesitation.
Kaspa Still Trades Inside A Descending Channel From 2024
Technical structure remains the biggest restraint on Kaspa price. Since the mid 2024 peak, KAS has traded inside a clear descending channel. Lower highs and controlled rebounds defined most of 2025, reinforcing a broader corrective phase rather than a trend reversal.
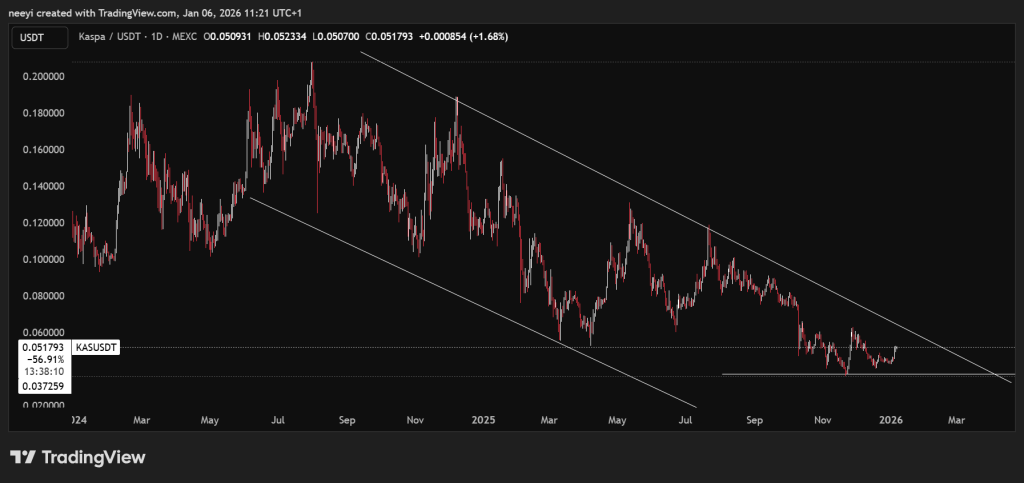
KAS Price Chart
January does not appear to change that structure yet. Price continues to respect the channel boundaries, suggesting the current move higher still fits within a larger consolidation. Breakouts above this pattern usually require strong follow through and broader market support.
Continuation inside this channel remains the most realistic short term expectation for KAS price.
Kaspa Support Near $0.037 Helped Trigger The Current Bounce
December provided an important technical development. Kaspa price tested support around $0.037 and held firmly. Buyers defended that zone multiple times, creating a base that allowed price to rebound as the new year began.
That support acted as a springboard, pushing KAS toward higher levels without heavy selling pressure. Current trading around $0.05 places price closer to the upper boundary of the descending channel, an area that often attracts cautious behavior from buyers. Support strength at $0.037 remains a key reference point for January.
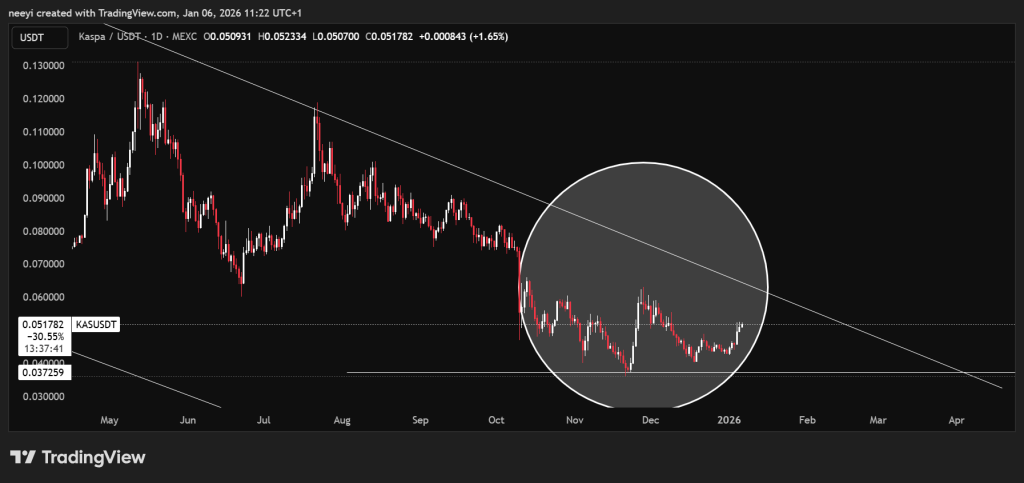
KAS Price Chart
As KAS price moves higher, resistance becomes more visible. The top of the descending channel sits not far above current levels, making sustained upside difficult without a strong catalyst. Many rallies within similar structures stall before achieving a full breakout.
This area often triggers profit taking, especially among short term traders who recognize the broader trend remains corrective. Without a decisive move above the channel, upside may remain limited despite improving sentiment.
Kaspa price nearing resistance creates a moment where patience becomes essential.
Super Bullish Kaspa Price Scenario Points Toward $0.08
A highly bullish outcome would require a clear break above the descending channel. Such a move would signal a structural shift rather than a simple retracement. Under that scenario, Kaspa price could extend toward the $0.08 region during January, especially if market momentum accelerates.
That outcome depends heavily on broader crypto strength. Sustained buying pressure across the market often gives smaller-cap projects room to break technical ceilings that previously capped price action.
This scenario remains possible, though confirmation would require strong follow-through.
Bearish Kaspa Price Scenario Brings Focus Back To $0.03 Support
Caution still applies. The broader pattern remains bearish, meaning the current move higher can still be interpreted as a bullish retracement rather than a trend reversal. Failure to hold higher levels could invite renewed selling pressure.
A bearish outcome would likely push Kaspa price back toward the $0.03 zone, where prior support proved reliable. Retesting that level would not automatically signal weakness, though repeated tests often increase risk over time. Price behavior near that support will matter if momentum fades.
How Much Might 20,000 Hedera (HBAR) Tokens Be Worth in 2026?_**
January opens with renewed interest in Kaspa, supported by improving market sentiment and a solid technical bounce. KAS price has recovered meaningfully, yet structure still limits expectations. Descending channel resistance remains the defining factor, shaping both bullish and bearish scenario
Disclaimer: The information on this page may come from third parties and does not represent the views or opinions of Gate. The content displayed on this page is for reference only and does not constitute any financial, investment, or legal advice. Gate does not guarantee the accuracy or completeness of the information and shall not be liable for any losses arising from the use of this information. Virtual asset investments carry high risks and are subject to significant price volatility. You may lose all of your invested principal. Please fully understand the relevant risks and make prudent decisions based on your own financial situation and risk tolerance. For details, please refer to
Disclaimer.
Related Articles
Pi Network Lists on Major CEX, Price Surges 30% in a Month Before Pi Day
Pi Network has seen a recent trading price increase of approximately 10%, primarily driven by the upcoming listing of the PI token on a major U.S. centralized exchange and Pi Day, which has boosted retail investor confidence. Technical analysis shows a bullish outlook in the short term, though caution remains warranted for the medium to long term. Community sentiment has warmed, indicating renewed retail interest, which provides support for short-term upside potential.
MarketWhisper25m ago
Ripple Splurges $750 Million on Share Buyback While XRP Continues Declining: Why Is the Company's Strategy Diverging from Token Value?
Ripple announced a $750 million stock buyback, with its company valuation potentially rising to $50 billion, yet the XRP token price continues to decline, exposing a decoupling phenomenon between the company and the token. Market confidence in Ripple and XRP is gradually diverging, requiring investors to clarify whether they are investing in company strength or token value, as they face challenges from regulation, utility, and market patience.
PANews31m ago
XRP Today's News: Rare Bottom Signal Appears, Technical Analysis Suggests Price Reversal Approaching
According to Glassnode data, XRP exhibits two major indicator signals indicating that the price is below its fair value, and the realized profit/loss ratio is approaching 1.0, which historically suggests a possible rebound. Additionally, XRP is consolidating within a symmetrical triangle pattern, with a key resistance at $1.50 and support at $1.30, as the market is about to experience a breakout in a specific direction.
MarketWhisper39m ago
VIA Soars 23.45% in Minutes — Traders React to Whale Activity
VIA's price surged by 23.45% in five minutes, currently trading at $0.002026. The rise is linked to increased whale activity and broader market trends, prompting traders to monitor key resistance and support levels.
Coinfomania48m ago
CryptoQuant: Ethereum Adoption Paradox Deteriorates, Price May Fall to $1500
Ethereum faces an "adoption paradox," where network activity reaches record highs but ETH price has fallen sharply, showing a divergence between the two. Analysis points out that current network activity growth primarily comes from automated contracts like DeFi, rather than genuine user demand, which intensifies selling pressure. If the bear market continues into 2026, ETH could fall to $1,500. Attention should be paid to changes in capital inflows and exchange inflows to determine whether ETH will emerge from the bear market.
MarketWhisper50m ago
Crypto market rebounds this morning, BTC touches $72,000, funding rates return to neutral
The crypto market rebounded on March 13, with Bitcoin recovering to 72,000 USD and Ethereum recovering to 2148 USD. Funding rates on major exchanges returned to neutral levels, indicating that bearish sentiment has eased. The funding rate is a mechanism that adjusts the relationship between contract prices and asset prices.
GateNews1h ago