Bitcoin starts 2026 with a sideways stance around the $88,000 mark, extending a trading range for several weeks. Although prices seem stagnant, on-chain data reveals subtle market movements beneath the surface.
Three indicators from CryptoQuant show selling pressure gradually easing, despite ongoing macro uncertainties that continue to restrain growth.
Long-term Holders Signal Accumulation
After a sharp correction at the end of 2025, Bitcoin is still struggling to regain key resistance levels. The lack of continuous buying has made market sentiment fragile, with traders patiently waiting for confirmation that the correction has truly ended.
The first signal comes from the supply data of the long-term holder group (LTH). After months of negative values, the net change in LTH supply over 30 days has turned positive, increasing by approximately 10,700 BTC.
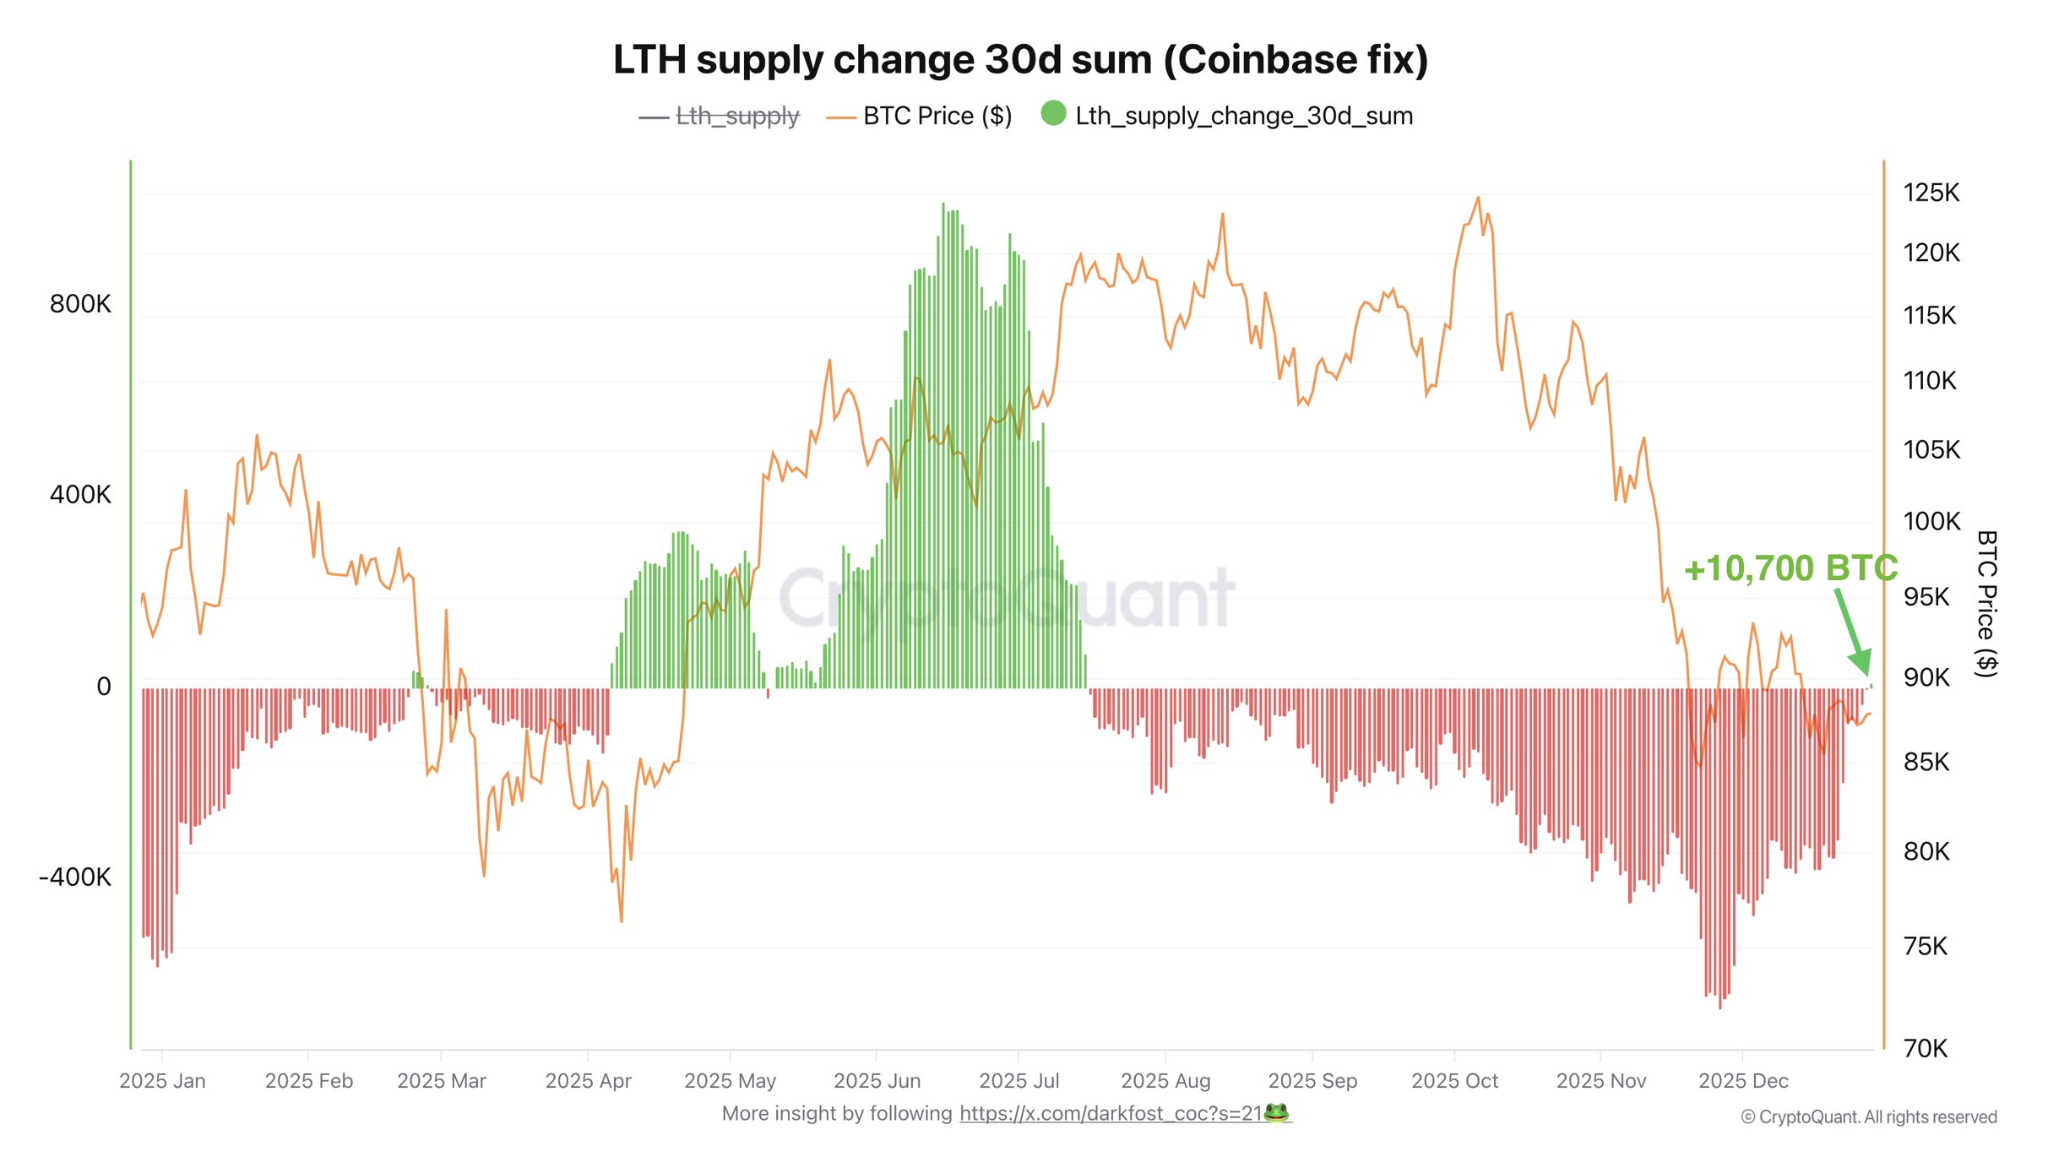 Bitcoin supply for long-term holders | Source: X/DarkfostThis development indicates that long-term investors have ceased widespread coin distribution. Instead, supply is gradually returning to the hands of steadfast holders — a pattern often seen during accumulation phases, rather than at market peaks.
LTH SOPR Indicator: Balance Instead of Giving Up
The second chart tracks the spent output profit ratio of long-term investors (SOPR). This index reflects whether they are selling at a profit or a loss.
Currently, LTH SOPR hovers around the neutral level of 1.0, indicating that long-term investors are not panicking or rushing to sell at a loss.
Historically, this behavior often coincides with the market finding its balance after a correction, rather than preparing for a deeper decline.
Outflow of Funds from Exchanges: Immediate Selling Pressure Diminishes
The third indicator focuses on Bitcoin net flow on exchanges. Recent data shows continued net outflows, with more BTC leaving exchanges than being deposited.
This helps reduce immediate sell pressure in the spot market.
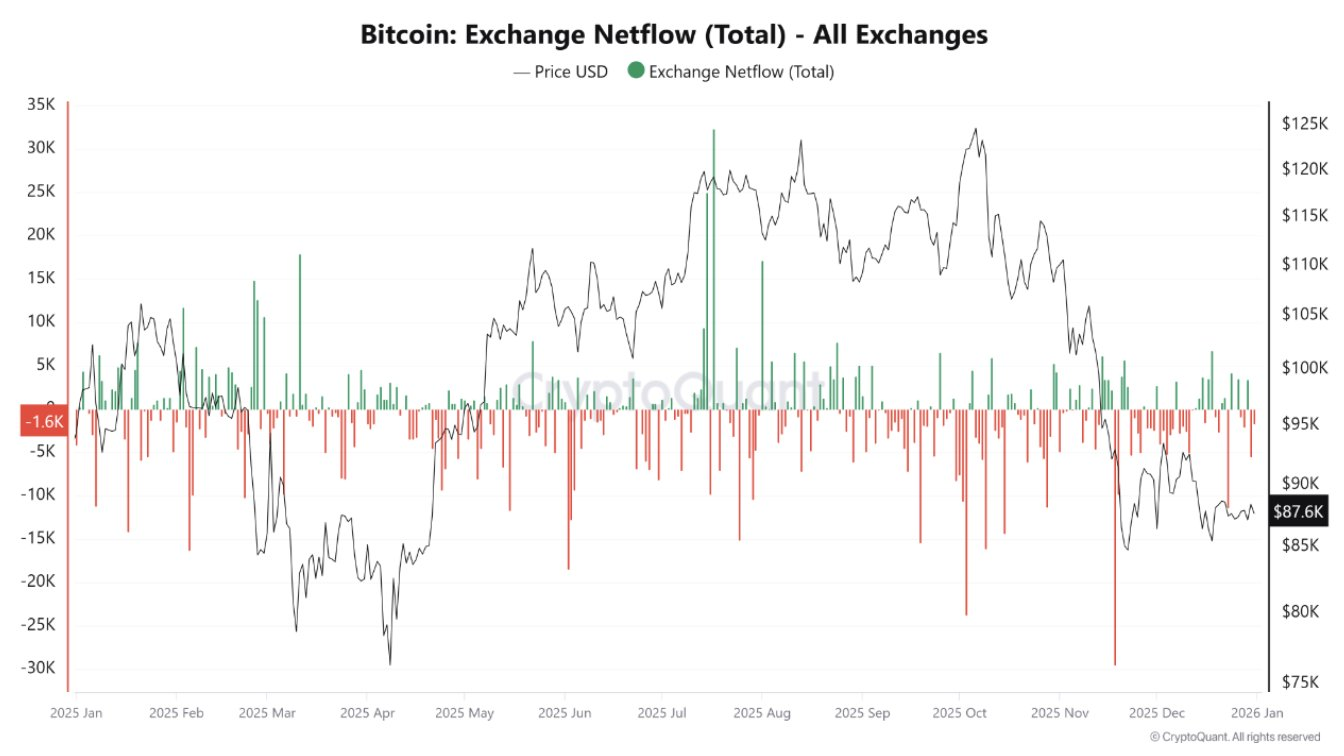 Bitcoin Exchange Net Flow | Source: X/CryptoQuantHowever, the inability of prices to recover strongly reflects cautious buying, possibly due to limited liquidity and delayed expectations of rate cuts in the US.
Bitcoin Recovery Outlook in January
Combining these three indicators, the Bitcoin market is gradually shifting toward a more positive outlook. Supply-side pressure is easing, and long-term investor confidence remains intact.
However, prices are still confined within a sideways range due to weak demand and macroeconomic barriers. For Bitcoin to break through the $100,000 mark in January, a new catalyst will be needed.
Without a breakthrough momentum, Bitcoin is likely to continue accumulating, building a foundation for a stronger recovery later in 2026, rather than experiencing an immediate sharp increase.
Mr. Giáo
Disclaimer: The information on this page may come from third parties and does not represent the views or opinions of Gate. The content displayed on this page is for reference only and does not constitute any financial, investment, or legal advice. Gate does not guarantee the accuracy or completeness of the information and shall not be liable for any losses arising from the use of this information. Virtual asset investments carry high risks and are subject to significant price volatility. You may lose all of your invested principal. Please fully understand the relevant risks and make prudent decisions based on your own financial situation and risk tolerance. For details, please refer to
Disclaimer.
Related Articles
Bitcoin Hashrate Slips Below 1 Zettahash as Miner Revenue Remains Thin
Bitcoin's hashrate has fallen below 1 zettahash due to diminished miner revenue, with hashprice at $31 per petahash. This has led to thinner margins for miners, who may benefit from an upcoming difficulty reduction.
Coinpedia24m ago
Bitcoin Cash Battles $459 Resistance as Massive Sell Walls Stack Toward $650
BCH is trading at $455.86 close to the resistance range of $459.20 with the support level of $447.44.
The chart data indicates that the chart has strong resistance levels at around $520, $580 and $650 which restricts the momentum on short term upside.
Following a sharp fall, price
CryptoNewsLand25m ago
Bitcoin and XRP Hold Gains as Regulatory Debate Shapes Market Outlook
Bitcoin and XRP maintained steady prices on Sunday as the broader cryptocurrency market posted modest gains. The recovery followed renewed buying activity and stronger market sentiment across major digital assets. Meanwhile, political debate in Washington over crypto regulation added a new layer
CryptoBreaking1h ago
Bitcoin Holds Firm Near $71,500 as Conflict Volatility Shakes Global Markets
Resistance Near $74,000 Remains the Key Barrier
Bitcoin repeatedly approached the $73,000 to $74,000 region but failed to break above that zone.
The market rejected the price four times near that level over recent weeks.
This resistance now forms the main barrier for the next major market
CryptoBreaking1h ago