
Date: Fri, Dec 26, 2025 | 06:30 PM GMT
The broader cryptocurrency market has been navigating a period of choppy and uncertain price action over the past several weeks, a phase that began after the sharp market-wide sell-off on October 10. During that correction, Ethereum (ETH) dropped nearly 28% over the last 60 days, applying sustained pressure across the altcoin sector — including ether.fi (ETHFI).
ETHFI has mirrored this weakness, sliding more than 31% over the same period. However, despite the sharp downtrend, recent price behavior suggests selling pressure may be easing. The token is now trading near a historically significant demand zone, where buyers have repeatedly stepped in before — raising the possibility that ETHFI could be approaching an inflection point.
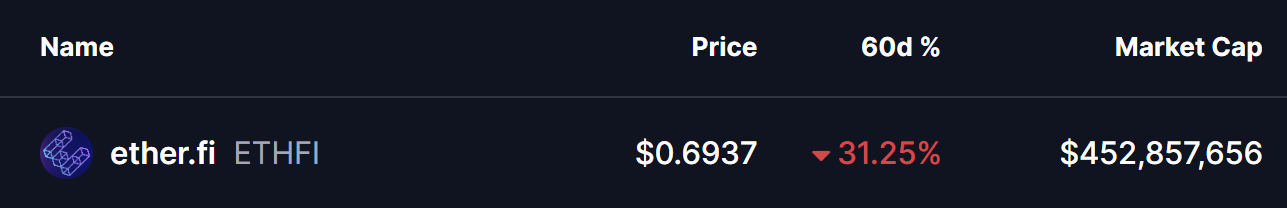
Source: Coinmarketcap
Double Bottom Pattern in Focus
On the daily timeframe, ETHFI appears to be forming a potential double-bottom structure — a classic reversal pattern that often signals exhaustion among sellers. The setup began after ETHFI was rejected from the $0.9233 resistance area, a move that triggered a sharp decline of nearly 28% and pushed price back toward the lower end of its range.
That sell-off dragged ETHFI into the $0.65 support zone, a level that has consistently acted as a strong demand area in the past. The chart now shows price revisiting this same region and stabilizing once again, suggesting buyers are actively defending it. The similarity between the first and second lows strengthens the case that a double-bottom base may be forming.
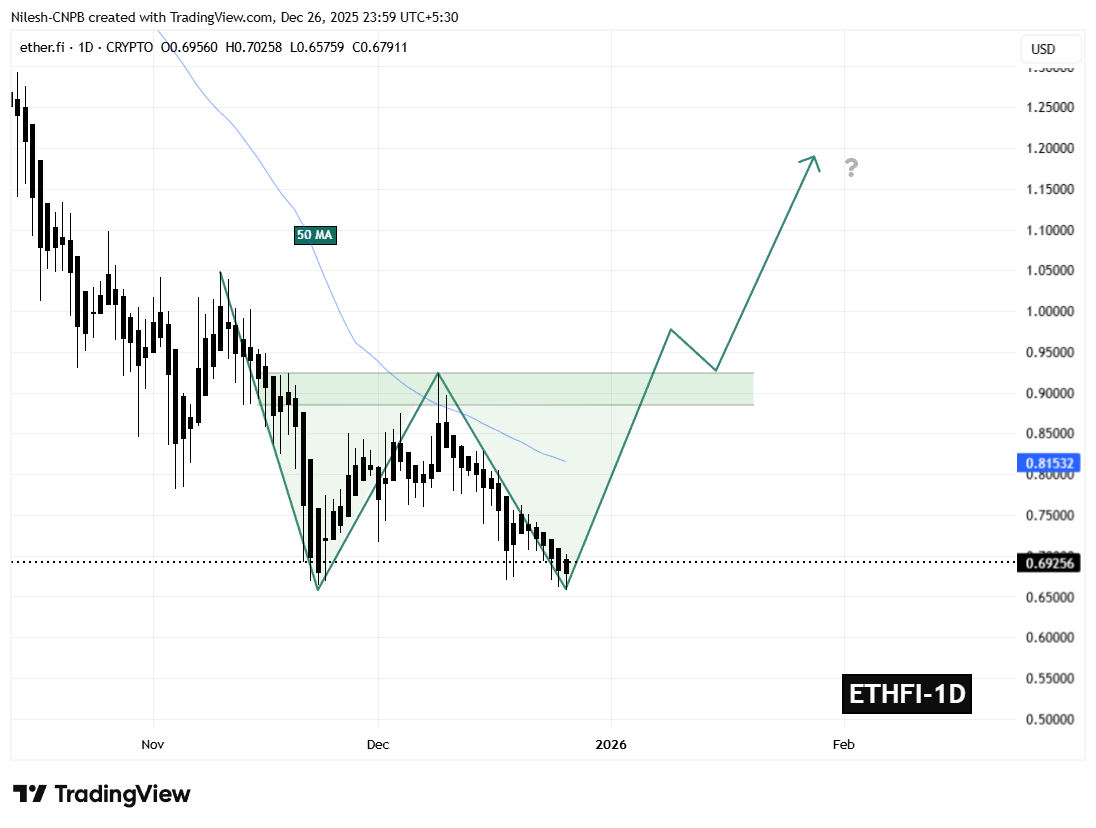
ETHFI Daily Chart/Coinsprobe (Source: Tradingview)
If this support continues to hold, the ongoing consolidation could mark the completion of the second bottom — a critical step in shifting momentum away from sellers and toward a potential trend reversal.
What’s Next for ETHFI?
The $0.65 support zone remains the most important level to monitor in the near term. As long as ETHFI holds above this area, the developing bullish structure remains valid and provides room for momentum to gradually rebuild.
On the upside, the first major challenge sits at the 50-day moving average near $0.8153. This level has repeatedly capped recovery attempts throughout the recent downtrend and now represents the initial test for buyers. A sustained move above this moving average would signal improving market structure and growing bullish confidence.
Beyond that, the $0.9233 neckline stands as the key confirmation level. A decisive breakout above this resistance would complete the double-bottom pattern and significantly strengthen the bullish outlook, potentially opening the door for a broader recovery move in the weeks ahead.
For now, ETHFI finds itself at a technically pivotal zone — one that could either reinforce the existing downtrend or mark the beginning of a meaningful rebound if buyers continue to defend support.
Disclaimer: The views and analysis presented in this article are for informational purposes only and reflect the author’s perspective, not financial advice. Technical patterns and indicators discussed are subject to market volatility and may or may not yield the anticipated results. Investors are advised to exercise caution, conduct independent research, and make decisions aligned with their individual risk tolerance.
Disclaimer: The information on this page may come from third parties and does not represent the views or opinions of Gate. The content displayed on this page is for reference only and does not constitute any financial, investment, or legal advice. Gate does not guarantee the accuracy or completeness of the information and shall not be liable for any losses arising from the use of this information. Virtual asset investments carry high risks and are subject to significant price volatility. You may lose all of your invested principal. Please fully understand the relevant risks and make prudent decisions based on your own financial situation and risk tolerance. For details, please refer to
Disclaimer.
Related Articles
XRP Today News: Leverage Ratio Drops 78% Sharply, On-Chain Transaction Volume Hits a New Annual High
XRP derivatives market leverage drops to its lowest level in nearly nine months, indicating that the market overheating pressure is easing. At the same time, XRPL’s weekly transaction volume reaches 19 million, driven by Ripple’s business progress and new partnerships. However, the technical risk XRP faces lies in its head-and-shoulders top pattern; the key support level is between $1.37 and $1.40, and a break below could lead to a pullback.
MarketWhisper1h ago
The price of HYPE is facing a risk of a 37% decrease as capital flow turns negative.
Hyperliquid (HYPE) is currently trading around $39, down 2.79%, with a double top formation indicating potential decline. A significant short liquidation zone at $42 acts as resistance, while dwindling CMF shows a shift to negative cash flow, suggesting a possible drop to $21 unless the price exceeds $42.
TapChiBitcoin1h ago
Crypto Fear Index rises to 13, market "fear" sentiment slightly eases
BlockBeats News, March 27 — According to Alternative data, today’s cryptocurrency Fear and Greed Index is 13 (yesterday was 10), indicating a slight easing of market "fear" sentiment.
Note: The Fear and Greed Index threshold is 0-100, including indicators: volatility (25%), market trading volume (25%), social media buzz (15%), market surveys (15%), Bitcoin’s proportion in the overall market (10%), and Google trending searches analysis (10%).
BlockBeatNews2h ago
Peter Brandt: Bitcoin shows a sell signal
Renowned trader Peter Brandt posted a chart indicating that Bitcoin's price is forming an ascending wedge pattern, suggesting a possible decline. The current price is in the $65,000-$70,000 range, and Brandt previously accurately predicted a short-term rebound for Bitcoin.
BlockBeatNews2h ago
The current mainstream CEX and DEX funding rates indicate that the market bearish sentiment has weakened.
According to BlockBeats, Bitcoin prices have slightly declined, and the funding rates on major exchanges indicate a weakening of the bearish market sentiment. The funding rate is a mechanism that adjusts the difference between the contract price and the underlying asset price.
BlockBeatNews2h ago
