

ADA trades near $0.371 on the 2H chart, after a rough month that flipped from a big spike into a steady grind lower. The move topped near $0.4837 in early December, then rolled over hard and bled into a lower-high, lower-low structure. That selloff finally printed a local low around $0.3483, and price has been trying to stabilize since then.
The last few sessions look more like a base than a bounce. ADA isn’t ripping higher, but it also isn’t making fresh lows. It’s chopping in a tight band and slowly pushing back above $0.36, which is the first line that matters right now. MASTR’s take fits this chart well: Solana-style “speed narratives” get attention, but charts still punish weak structure. ADA has been in “punishment mode” most of this month.
-
ADA Chart: Support and resistance zones that matter
-
RSI, MACD, and positioning: what the chart is saying
-
ADA price prediction for the next 7 days
ADA Chart: Support and resistance zones that matter
Support is clearly defined at $0.36. Price keeps reacting around it and it lines up with the current consolidation floor. Below that, the key downside level is the recent wick low near $0.348. If that breaks, the chart opens the door for another quick flush, because there isn’t much structure built between $0.35 and the next demand pocket.
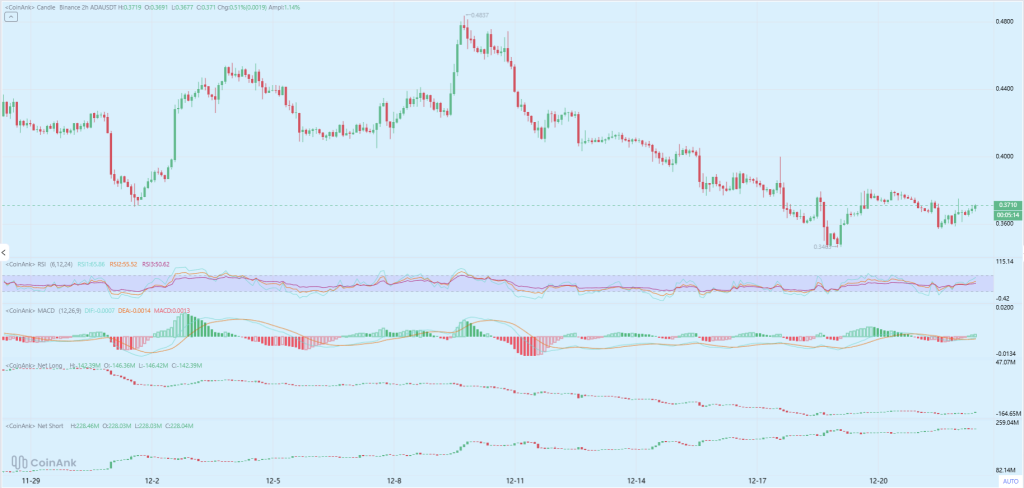

Source: CoinAnk
On the upside, the ADA price needs to reclaim $0.38–$0.39 first. That zone has capped rebounds during the recent slide and it lines up with the area where sellers stepped in repeatedly. If bulls can push through that band and hold it, the next target becomes $0.40, then the wider resistance zone around $0.42–$0.44, where price previously traded before the bigger breakdown.
In simple terms: $0.36 is the floor, $0.38–$0.39 is the ceiling, and $0.40 is the first real “momentum test.”
RSI, MACD, and positioning: what the chart is saying
RSI is no longer stuck in weak territory. The 6/12/24 RSI readings sit around 55.86 / 55.52 / 50.62. That’s not euphoric, but it’s a clear shift away from the oversold-style behavior seen during the drop. Momentum has cooled off, then quietly rebuilt.
MACD is trying to turn constructive, but it’s still fragile. The histogram is slightly positive at about 0.0013, while DIF (-0.0007) and DEA (-0.0014) remain just under zero. That usually reads as “bear trend slowing down” rather than “new uptrend confirmed.” In practice, it supports the idea that ADA is basing, but it still needs a clean break above resistance to prove the reversal.
The positioning data leans bearish, even as price stabilizes. Net longs have been drifting lower and sit near 142.39M on the latest print, while net shorts have climbed and sit near 228.04M. The shape matters too. Shorts stepped up across the month, while longs bled out. That’s the backdrop of this consolidation: sellers still control the bigger structure, but the selling pressure is no longer accelerating.
ADA price prediction for the next 7 days
**Bullish scenario: **ADA holds $0.36, breaks $0.38–$0.39, and builds acceptance above that zone. If that happens, $0.40 becomes the first target quickly. Follow-through can extend into $0.415–$0.44, especially if RSI stays in the mid-50s and MACD continues to improve. This is the “base turns into a breakout” path.
**Bearish scenario: **ADA loses $0.36 with momentum, then price revisits $0.348. If that level fails, the move can turn into another fast drop, because the prior selloff left thin support below the recent low. This is the “range breaks down and shorts press” path, and net shorts rising makes it a real risk.
**Neutral scenario: **ADA stays stuck between $0.36 and $0.39 for most of the week. That would fit the current indicators. RSI stays stable, MACD stays near flat, and price keeps chopping until a larger catalyst forces a direction.
Right now, ADA looks like it’s trying to stop the bleeding, not start a new trend. The week’s direction comes down to one simple question: can bulls flip $0.38–$0.39 into support, or do sellers push it back under $0.36 again?
Disclaimer: The information on this page may come from third parties and does not represent the views or opinions of Gate. The content displayed on this page is for reference only and does not constitute any financial, investment, or legal advice. Gate does not guarantee the accuracy or completeness of the information and shall not be liable for any losses arising from the use of this information. Virtual asset investments carry high risks and are subject to significant price volatility. You may lose all of your invested principal. Please fully understand the relevant risks and make prudent decisions based on your own financial situation and risk tolerance. For details, please refer to
Disclaimer.
Related Articles
Bitcoin Rejects $76K as War and PPI Rock Markets
_ Bitcoin rejected $76,000 resistance as US strikes on Iran, hot PPI at 3.4%, and Powell’s FOMC tone sent crypto and risk assets into a sell-off._
Bitcoin hit $76,000 and turned back around. The rejection was clean. Sellers were waiting right at the level that traders had marked for
LiveBTCNews1h ago
Why Is the River (RIVER) Price Pumping Today
River is suddenly awake again while the rest of the market is just kind of hanging out. The RIVER price jumped more than 14% in the last 24 hours, pushing up toward $25.65, and honestly, there’s no obvious catalyst. No big partnership announcement, no exchange listing, no protocol upgrade.
CaptainAltcoin2h ago
Ethereum Approaches Cycle Low as Bitmain Indicates Violent Belief
The article explores Ethereum's potential market bottom, highlighting its correlation with past S&P 500 trends and significant institutional investment by Bitmain. Despite mixed market sentiment, historical patterns suggest possible recovery.
CryptoBreaking2h ago
DOGE Stabilizes At $0.09438 As TD Sequential Buy Signal Suggests Rising Accumulation Phase and Po...
Dogecoin (DOGE) shows potential for a significant rally as it flashes a TD Sequential buy signal, indicating early accumulation despite recent declines. With key support at $0.0892 and strong whale activity, a price surge to $0.18876 could be on the horizon.
BlockChainReporter3h ago
BTC Breaks Through $73,000, Mainstream CEX Cumulative Short Liquidation Intensity Reaches $834 Million
According to Coinglass data, if the Bitcoin price breaks through $73,000, it will trigger $834 million in short liquidations; if it falls below $69,000, it will trigger $940 million in long liquidations. This demonstrates the potential impact of market liquidity fluctuations.
GateNews6h ago
