Bitcoin (BTC) attempted to recover on Monday, but selling pressure remains dominant with no clear signs of weakening. Trader CrypNuevo stated in a series of posts on platform X that BTC is likely to continue fluctuating within a broad accumulation zone from $80,000 to $99,000. Notably, if the price breaks below the key support level of $80,000, a deep decline toward the $73,000 region could entirely occur.
With a cautious outlook, technical analyst Aksel Kibar believes BTC is approaching a phase of strong volatility after forming a “very low volatility setup.” According to Kibar, in a positive scenario, surpassing the $94,600 mark could open up room for an upward move to the $100,000 region. Conversely, if a negative trend prevails, BTC may find a new equilibrium point within the $73,700–$76,500 range.
In addition to technical factors, analysts are paying close attention to the monetary policy actions of the Bank of Japan (BoJ), which is expected to raise interest rates on 19/12. Data shared by AndrewBTC shows that each rate hike by BoJ since 2024 has been accompanied by a more than 20% adjustment in Bitcoin, raising concerns about short-term downward pressure.
In this context, the question arises whether Bitcoin and large-cap altcoins can initiate a short-term recovery, or if the bears will continue to control the market and push prices lower. Let’s analyze the technical developments of the top 10 cryptocurrencies to find answers for the upcoming scenario.
Technical Analysis of SPX
The S&P 500 index (SPX) declined from the resistance zone of 6,920 on Friday, indicating that the bears are aggressively defending this level.
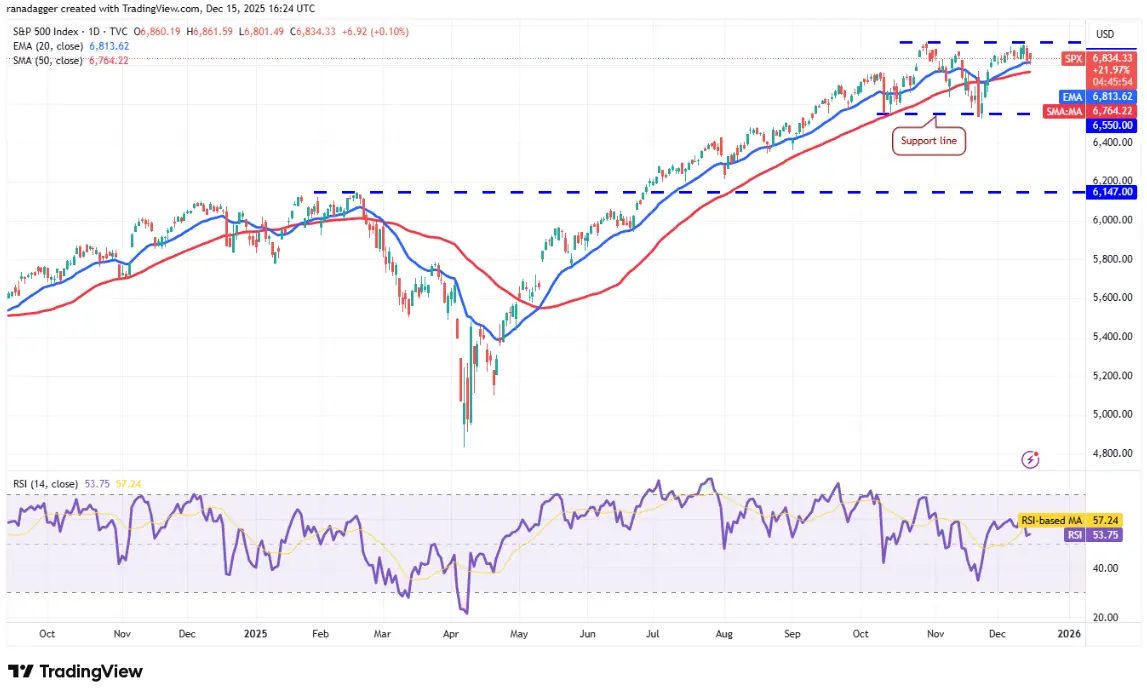 Daily SPX Chart | Source: TradingView If the price breaks below the moving averages, this suggests the index may continue to fluctuate within the 6,550–6,920 range for a few more days. A close below 6,550 will form a double top pattern, opening the possibility of a decline to the pattern’s target at 6,180.
Conversely, if the price rises back above the moving averages and crosses the 6,920 mark, it signals a resumption of the uptrend. The index could then surge toward the 7,290 target.
Technical Analysis of DXY
The USD index (DXY) attempted to rise above the 20-day exponential moving average (EMA) at 99.04 on Tuesday, but the bears maintained their stance.
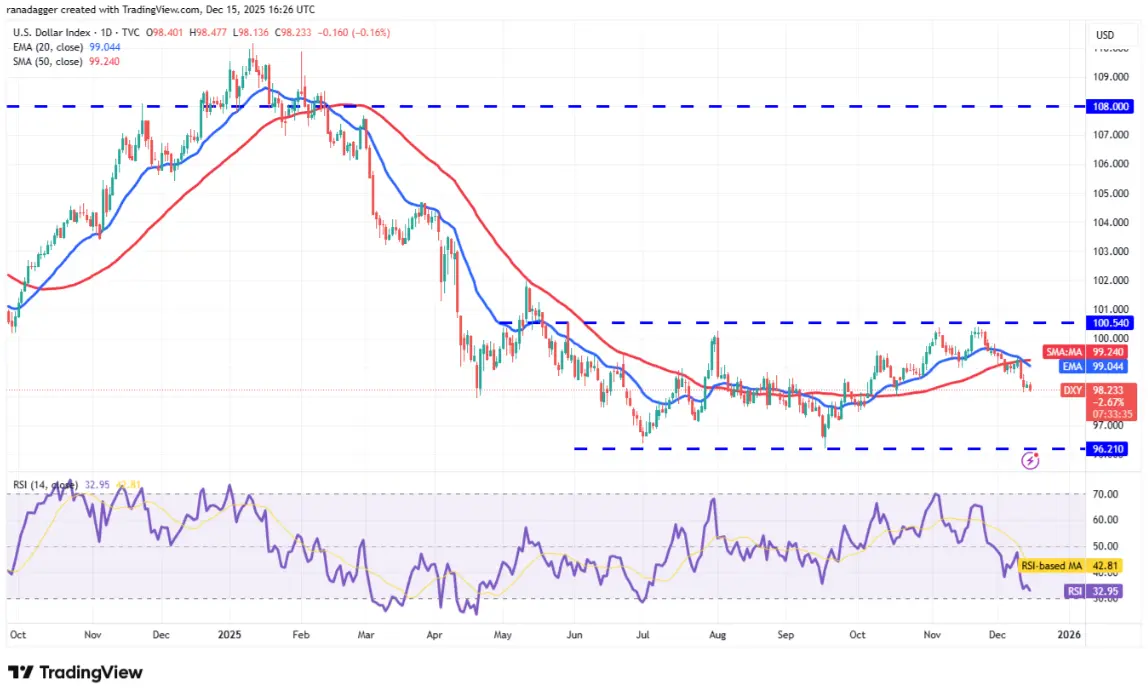 Daily DXY Chart | Source: TradingView The moving averages have completed a bearish crossover, while the relative strength index (RSI) remains in the negative zone, indicating short-term dominance by the bears. The 98 level acts as minor support, but if sellers push the price below this, the index could decline to 97.20 and then 96.21.
The first sign of strength would be a break and close above the 20-day EMA. Buyers will regain control if the price closes above the resistance at 100.54.
Technical Analysis of BTC
BTC bounced from the upward trendline on Monday, but the bulls failed to overcome the resistance at the 20-day EMA (90,720 USD).
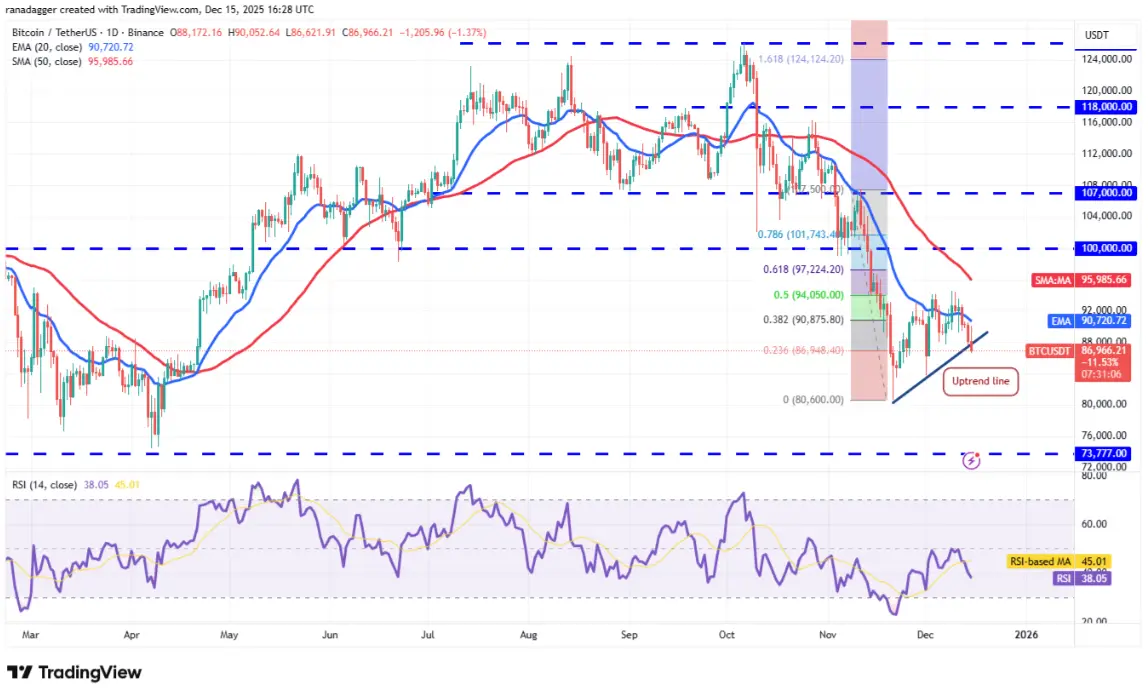 Daily BTC/USDT Chart | Source: TradingView The 20-day EMA has started to slope downward, and the RSI remains in the negative zone, indicating a slight advantage for the bears. If the price closes below the upward trendline, the BTC/USDT pair could plunge to $84,000 and eventually to the November 21 bottom at $80,600.
On the other hand, if the price strongly rebounds from the current zone and closes above the 20-day EMA, it suggests buying interest at lower levels. Then, the pair could rise toward the 50-day simple moving average (SMA) at $95,985. The bears are expected to defend the zone between the 50-day SMA and the $100,000 mark, as a breakout above this area would indicate the correction phase has ended.
Technical Analysis of ETH
The bulls pushed Ether (ETH) above the 20-day EMA at $3,106 on Monday, but long wicks indicate selling pressure at higher levels.
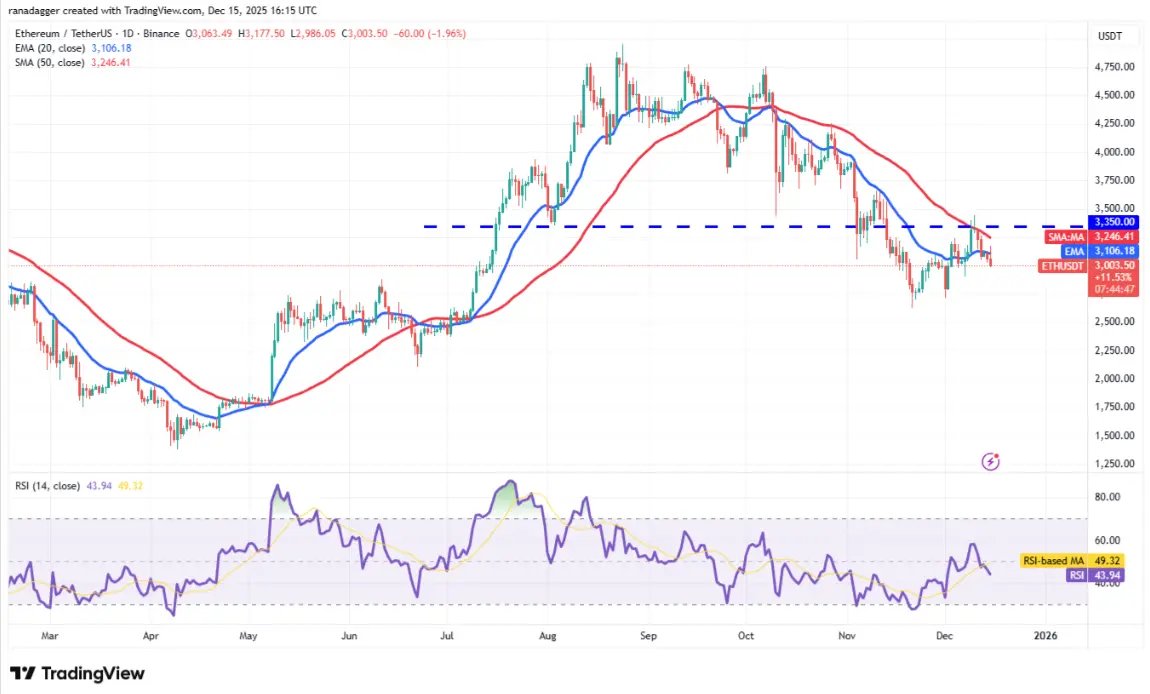 Daily ETH/USDT Chart | Source: TradingView The bears will attempt to push the ETH price below $2,907. If successful, ETH/USDT could decline to the support zone of $2,716–$2,623.
This negative view will be invalidated if the price reverses and rises above the previous breakout level at $3,350. This would suggest a short-term bottom has formed. Then, the price could rise to $3,658 and higher to $3,918.
Technical Analysis of BNB
BNB (BNB) has been trading sideways within a narrow range, and the correction has resolved downward, indicating a slight advantage for the bears.
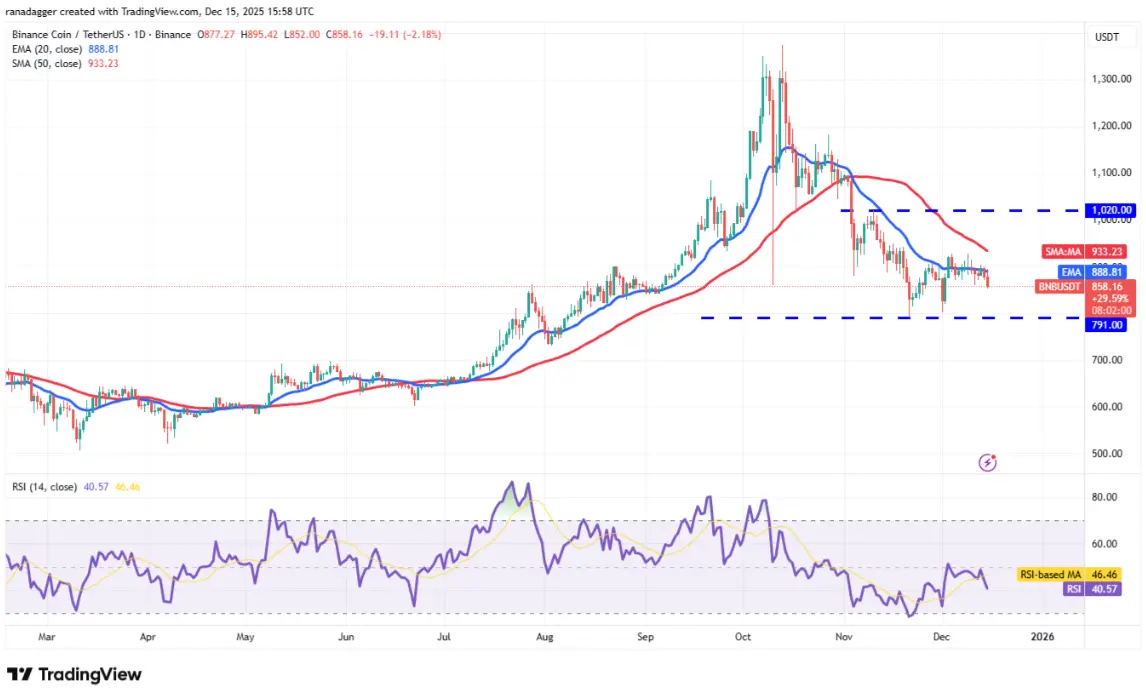 Daily BNB/USDT Chart | Source: TradingView Sellers will attempt to drive the price down to the critical support at $791. If this level is broken, BNB/USDT could resume its decline toward the next support at $730.
On the upside, if BNB’s price rebounds strongly from $791 and crosses the 20-day EMA at $888, it suggests the pair may form a trading range. Price could fluctuate between $791 and $1,020 over the next few days.
Technical Analysis of XRP
XRP (XRP) remains trapped below the 20-day EMA at $2.06, indicating a lack of aggressive buying from the bulls.
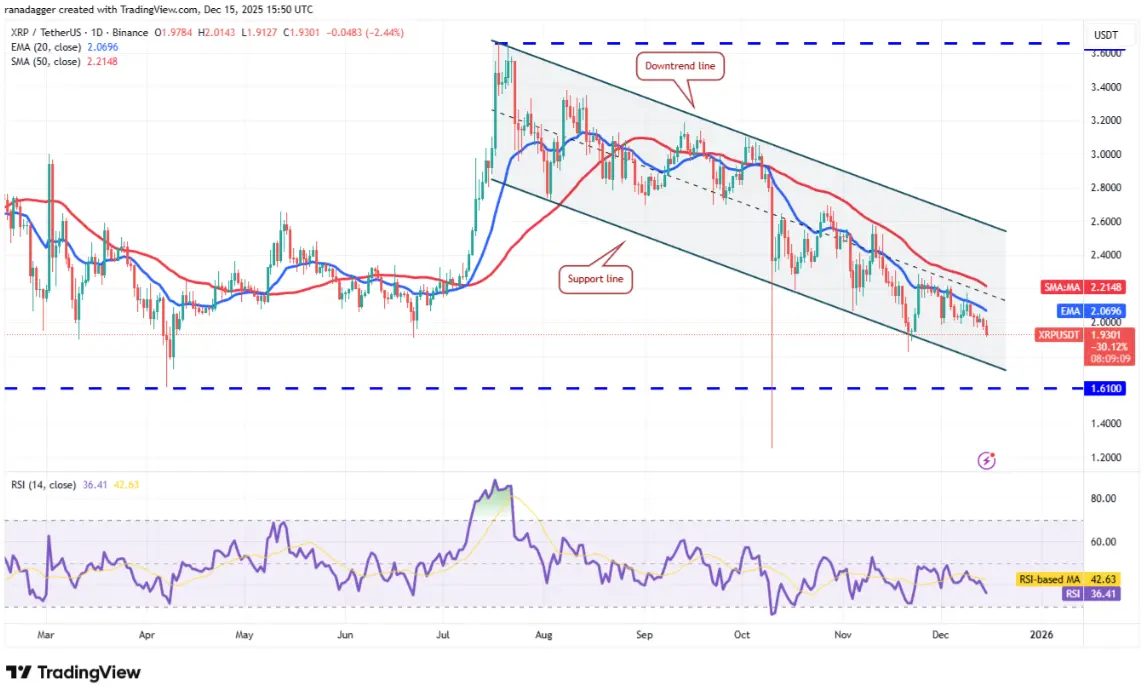 Daily XRP/USDT Chart | Source: TradingView The bears will try to pull XRP down to the decreasing channel support and then to $1.61. The bulls are expected to defend the $1.61 level at all costs, as breaking below this could pull XRP/USDT down to the October 10 bottom at $1.25.
To signal strength, bulls must push the price above the 50-day SMA at $2.21. If successful, the pair could rise toward the downward trendline, where strong resistance from the bears is anticipated.
Technical Analysis of SOL
Solana (SOL) has formed a symmetrical triangle pattern, indicating indecision and standoff between bulls and bears.
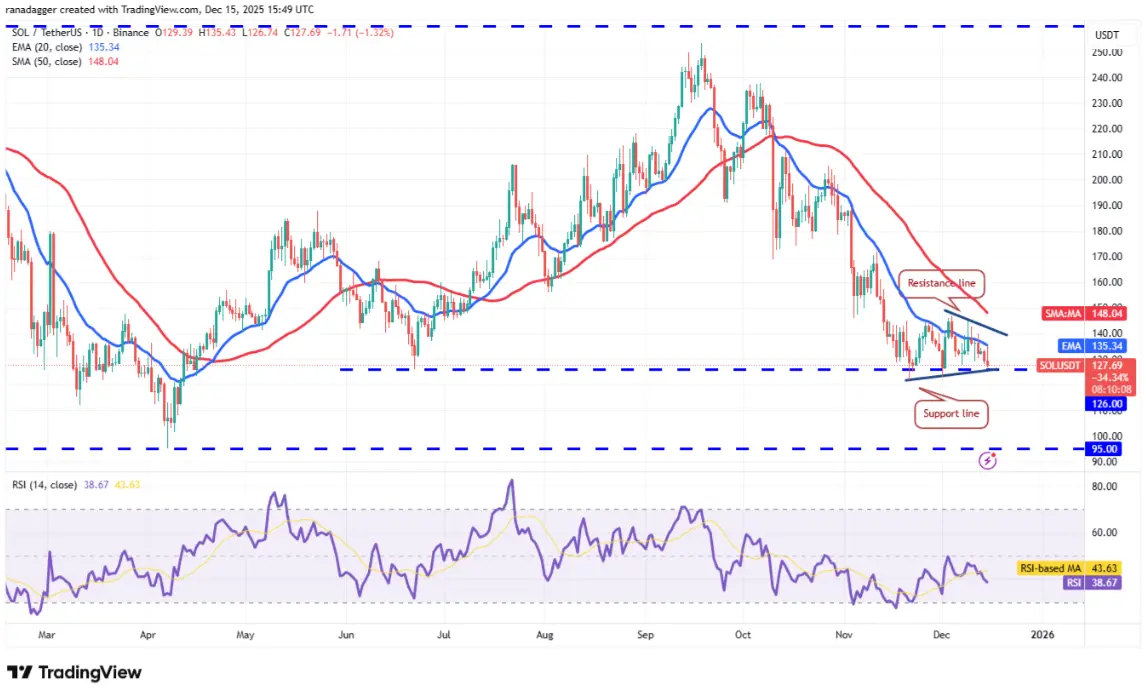 Daily SOL/USDT Chart | Source: TradingView If the price reverses lower and breaks below the triangle’s support line, it signals that the bears have gained the upper hand. The SOL/USDT pair could then plunge toward the strong support zone at $95.
Alternatively, a breakout and close above the triangle’s resistance line indicates the bulls are attempting to regain control. In this case, Solana’s price could rise to $172 and higher to $189.
Technical Analysis of DOGE
Sellers are trying to consolidate their position by pushing Dogecoin (DOGE) below the support level of $0.13.
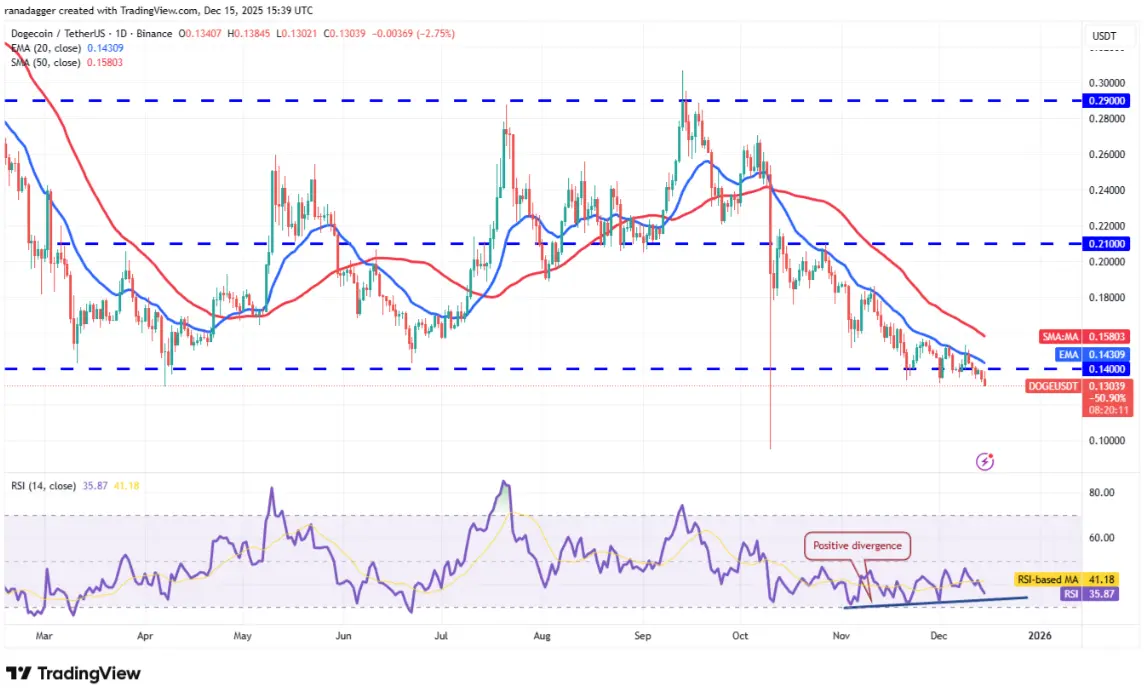 Daily DOGE/USDT Chart | Source: TradingView If successful, Dogecoin could resume its decline, with DOGE/USDT dropping sharply toward the October 10 bottom at $0.10, an area likely to attract significant buying interest from the bulls.
Bulls will need to push Dogecoin above the 20-day EMA at @$0.14( to signal strength. If achieved, the pair could rise toward $0.19. A break below $0.14 might just be a “bear trap.”
Technical Analysis of ADA
Cardano )ADA( continues to slide toward the $0.37 zone, a critical support level to watch in the short term.
![])https://img-cdn.gateio.im/webp-social/moments-cfe0d23e5fce830674c7f330b2f3be95.webp(Daily ADA/USDT Chart | Source: TradingView If bears push ADA below $0.37, it signals the start of the next leg down. The pair could then plunge toward the October 10 bottom at $0.27.
Conversely, if the price reverses and rises above the 20-day EMA )$0.42(, it indicates the pair may consolidate within a range from $0.37 to $0.50 for some time. Buyers will need to push above $0.50 to signal a potential trend reversal.
Technical Analysis of BCH
Bitcoin Cash )BCH( has broken below the 20-day EMA )$560(, indicating that the bulls are gradually losing control.
![])https://img-cdn.gateio.im/webp-social/moments-c399d7ddb4f6e8aebf2911204ab82537.webp(Daily BCH/USDT Chart | Source: TradingView The next support zone below is the 50-day SMA )$534(, followed by $508. This suggests BCH may continue to fluctuate within the range for some more time.
Buyers will need to push and hold above )to signal a resumption of the uptrend. If successful, BCH/USDT could challenge the important resistance zone above at $651.