As of January 6, Solana broke through $137 with a weekly gain of 7%. Spot ETF inflows reached $16.24 million on Monday, creating a new high since mid-December, with total net assets exceeding $1 billion. Stablecoin supply rebounded to $15.32 billion, with a clear buyer-dominated trend. Technically, after breaking through the wedge and consolidating above the 50-day EMA, RSI surged to 63, targeting $150.61.
Spot ETF Capital Inflows Create New High Since Mid-December
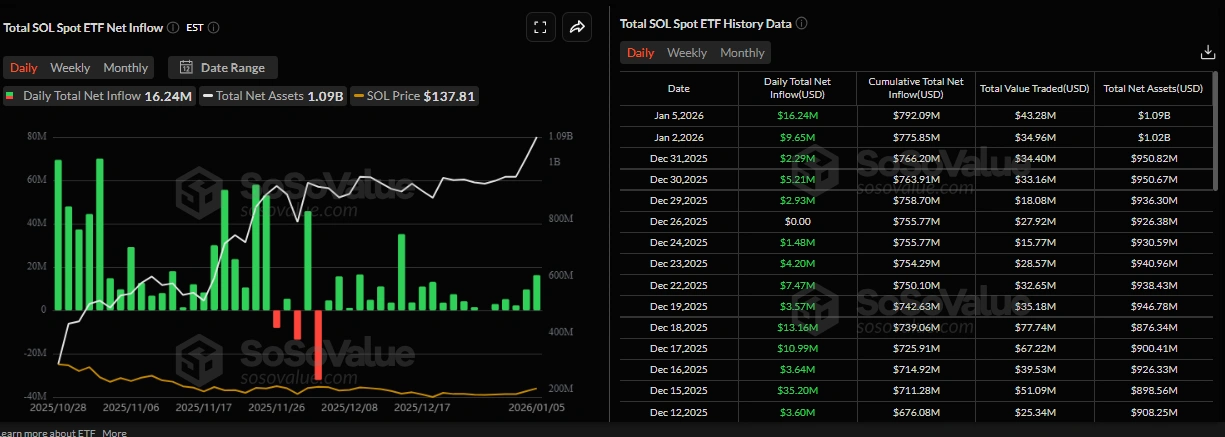
(Source: SoSoValue)
Since its launch on October 28, Solana institutional demand has continued to grow. SoSoValue data shows that Solana spot ETF recorded $16.24 million in capital inflows on Monday, marking the highest single-day inflow since mid-December. Additionally, total net assets have exceeded $1 billion this week to date, indicating sustained rise in institutional demand. If capital inflows continue and intensify, SOL price could experience a rally.
This return of institutional buying mirrors the V-shaped reversal logic of Bitcoin’s Coinbase premium index. Year-end accounting selling pressure in late December forced institutions to liquidate losing positions for tax optimization. As the new fiscal year starts in 2026, these funds begin reallocation. Solana’s spot ETF, as a compliant channel for institutional participation in the Solana ecosystem, naturally becomes the preferred vehicle for capital reflow.
Breaking through $1 billion in total net assets holds significant symbolic meaning. This not only represents institutional recognition of Solana’s long-term prospects but also shows that Solana has upgraded from “high-risk altcoin” to “institutional-grade allocation target.” As ETF net assets continue to expand, issuers need to purchase equivalent SOL in the spot market for support, with this passive buying providing stable upward momentum for prices.
If the capital inflow trend continues, Solana’s spot ETF total net assets could potentially break through $1.5 billion to $2 billion in Q1. This scale of institutional holdings will significantly reduce SOL’s circulating supply, as tokens held by ETFs are typically locked long-term in custodial cold wallets. Supply contraction combined with rising demand is a classic combination for driving sustained price increases.
Dual Verification from Stablecoin Market Cap and Whale Activity
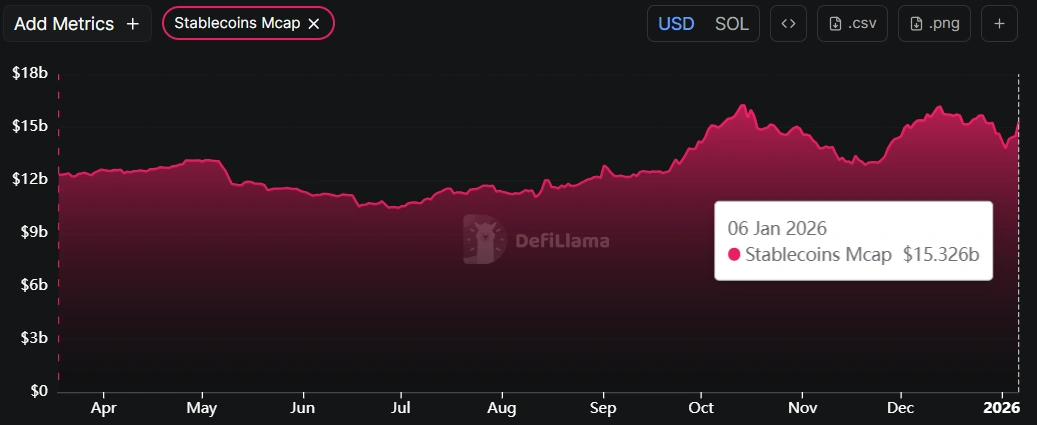
(Source: DefiLlama)
DefiLlama data shows that total SOL stablecoin supply has been rebounding since early January and has now reached $15.32 billion. The activity and value growth of SOL project stablecoins indicate positive prospects, as this will enhance network utilization and attract more users into the ecosystem. Stablecoin market cap is one of the core indicators for measuring public chain health, as it directly reflects the scale of on-chain economic activity.
When users transfer stablecoins like USDC and USDT onto the Solana chain, it means they are preparing to conduct transactions, lending, or other DeFi activities within the Solana ecosystem. Rising stablecoin market cap indicates that funds are flowing in rather than out of Solana. With $15.32 billion in stablecoin market cap, Solana has become the third-largest stablecoin public chain after Ethereum and Tron, solidifying its core position in the DeFi ecosystem.
CryptoQuant aggregated data shows that Solana spot and futures markets both display large block orders, market cooling, and buyer-dominated trends, indicating a bullish market outlook. All these factors suggest that trader sentiment is improving, hinting that bull market conditions may continue over the coming days. The appearance of large block orders typically represents whales or institutions building positions; these players’ capital scale and holding periods often provide strong price support.
Market cooling refers to excessively high leverage ratios and funding rates returning to normal levels. Historically, when Solana surged, it was often accompanied by extremely high funding rates—an unsustainable overheated state. Current market conditions show moderate appreciation with healthy leverage, making this increase more sustainable and less prone to cascading liquidations from unexpected events.
Three On-Chain Indicators Strengthen Simultaneously
Stablecoin Market Cap Rebounds to $15.32 Billion: Indicates funds are flowing into the Solana ecosystem with heating on-chain economic activity. Such capital inflows typically lead price changes by 1-2 weeks, serving as a leading indicator.
Increased Whale Activity: Rising large block order counts indicate major holders are accumulating chips. Whale accumulation behavior is typically based on in-depth research and long-term judgment, carrying high reference value.
Strengthened Buyer Dominance: The comparison of buy-sell pressure in spot and futures markets shows buyer force has surpassed sellers. Such dominance reversals often mark the beginning of trend reversals.
Technical Breakout of Wedge Targets $150
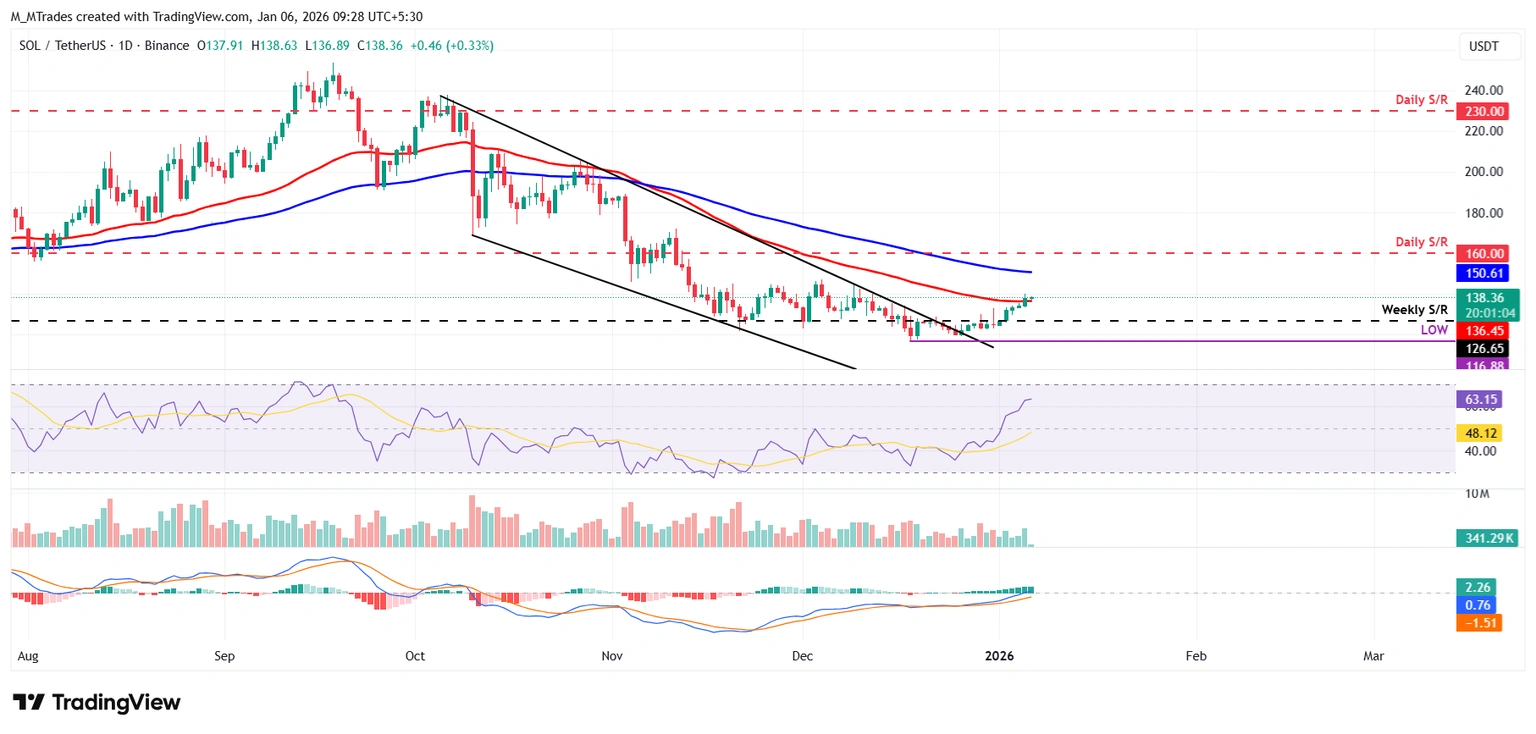
(Source: Trading View)
On December 26, Solana price broke through the upper trendline of the descending wedge formation (formed by multiple highs and lows connected since early October). As of Monday, the price rose more than 12%, closing at $163.45, above the 50-day exponential moving average (EMA). As of Tuesday, SOL traded above $137.
If SOL continues to rise, the uptrend may extend to the next resistance level of $150.61, which is its 100-day moving average. This position is a key watershed for intermediate trends; if it breaks through and consolidates above it, it will confirm a complete trend reversal. On the daily chart, the Relative Strength Index (RSI) stands at 63, above the 50 neutral level, indicating that bullish momentum is strengthening.
The Moving Average Convergence Divergence (MACD) shows a golden cross with green histogram bars breaking above the neutral level, further supporting the bullish view. MACD golden cross is a classic trend reversal signal; when the fast line crosses above the slow line from below, it typically signals the beginning of an uptrend. Currently, not only has MACD formed a golden cross, but the histogram has also turned positive, providing dual confirmation of strengthening bullish force.
On the other hand, if SOL experiences a pullback, it may continue declining and find support near $126.65 at the weekly level. This position is the lower boundary of the previous consolidation range and a key battleground for short-term bulls and bears. If this support breaks, Solana could retest $120 or even lower levels.
btc.bar.articles
Gate วันพุธบ้าคลั่งเปิดตัวแล้ว ทำงานให้สำเร็จเพื่อชนะ FOGO และกล้องเลกา USDT การจัดการเงินสูงสุด 100% ต่อปี การ Stake BTC, ETH, SOL สูงสุด 16% ต่อปีจากการขุด
ข้อความจาก Gate News Bot ตามประกาศอย่างเป็นทางการของ Gate เมื่อวันที่ 18 มีนาคม 2026
Gate เปิดตัวกิจกรรม "Crazy Wednesday" ซึ่งจะดำเนินการตั้งแต่เวลา 14:00 น. วันที่ 18 มีนาคม 2026 ถึง 16:00 น. วันที่ 22 มีนาคม 2026 (UTC+8) ผู้ใช้สามารถปลดล็อกกล่องสุ่มโดยการทำงานหลายรายการเช่น Flash Exchange, Spot Trading, Futures Trading และการฝากเงิน รางวัลประกอบด้วยโทเค็น FOGO กระเป๋าโชค และกล้อง Leica โดยมีการรับประกัน 100% ได้รับรางวัล
ในช่วงเวลาของกิจกรรม แพลตฟอร์มเปิดตัวผลิตภัณฑ์การเงินประจำ 14 วัน USDT โดยมีอัตราผลตอบแทนต่อปี 8% ผู้ใช้ใหม่สามารถรับสิทธิพิเศษผลตอบแทนต่อปี 100% เป็นเวลา 3 วัน นอกจากนี้ยังมีผลิตภัณฑ์การเงินเงินคงเหลือ รวมถึง 0G, APT, AZTEC, IDOS โดยมีอัตราผลตอบแทนต่อปีสูงสุดถึง 300% ผู้ใช้ที่ stakes BTC, ETH, SOL สามารถรับอัตราผลตอบแทนต่อปีสูงสุด 16% ซึ่งการ stakes SOL 0-1 อัน สามารถรับผลตอบแทนต่อปี 16% ทุกรางวัลจะแจกจ่ายภายใน 14 วันทำการนับจากวันสิ้นสุดกิจกรรม
GateAnnouncement6 นาที ที่แล้ว
กระเป๋าเงิน Solana Phantom ทำลายสถิติ: CFTC อนุมัติการเชื่อมต่ออนุพันธ์แบบไม่ดูแลรักษา
Phantom ซึ่งเป็นกระเป๋าเงินแบบจัดการตัวเองบน Solana ได้รับจดหมายที่ไม่มีข้อคัดค้านจาก CFTC ซึ่งทำให้สามารถเชื่อมต่ออินเทอร์เฟซแบบไม่ได้รับการดูแลโดยตรงกับตลาดอนุพันธ์ที่ลงทะเบียนกับ CFTC โดยไม่จำเป็นต้องลงทะเบียนเป็นบริษัทนายหน้านำเสนอ การ突破นี้อนุญาตให้ผู้ใช้เข้าถึงอนุพันธ์ที่ได้รับการกำกับดูแลในขณะที่รักษาการควบคุมกองทุนไว้ ซึ่งสร้างรูปแบบการปฏิบัติตามกฎหมายสำหรับกระเป๋าเงินสกุลเงินดิจิทัลในอนาคต กลยุทธ์ของ Phantom คือการสื่อสารกับหน่วยงานกำกับดูแลล่วงหน้าเพื่อให้แน่ใจว่าการดำเนินการถูกต้องตามกฎหมาย
MarketWhisper3 ชั่วโมง ที่แล้ว
วาฬขนาดใหญ่ถอนเหรียญ SOL กว่า 12 หมื่นเ枚จากแอกซ์หนึ่ง หลังจากที่นิ่งเงียบมา 4 เดือน มูลค่าประมาณ 1147 หมื่นดอลลาร์สหรัฐ
18 มีนาคม Lookonchain ตรวจพบที่อยู่วาฬใหญ่ที่ถูกปล่อยให้นิ่งเงียบ 4 เดือนเพิ่มเติมการถ่ายโอน 121,480 SOL มูลค่า 11.47 ล้านดอลลาร์ 4 เดือนที่แล้ว ที่อยู่นี้เคยถ่ายโอน 186,621 SOL มีการสูญเสียตามบัญชีมากกว่า 8 ล้านดอลลาร์ และยังคงซื้อ SOL เพิ่มเติม
GateNews4 ชั่วโมง ที่แล้ว
ETF SOL สหรัฐฯ สำหรับซื้อขายในตลาดสด มีเงินไหลเข้าในวันเดียวกันจำนวน 17,810,700 ดอลลาร์
March 17, SOL spot ETF in the US recorded a single-day net inflow of $17.81 million, primarily from Bitwise Solana Staking ETF, with cumulative historical net inflows reaching $803 million. As of now, total assets under management are $937 million, with a net asset ratio of 1.73%.
GateNews4 ชั่วโมง ที่แล้ว
ข่าวคริปโต: DeepSnitch AI เปิดตัววันที่ 31 มีนาคม เทรนด์กำลังเป็นที่นิยมเมื่อเทรดเดอร์วางเดิมพันเพื่อกำไร 100 เท่า กลยุทธ์สะสม 22K BTC, SOL ทำลายระดับ $95
Michael Saylor ได้แสดงท่าทีราคาขึ้นด้วย Strategy 22K Bitcoin เมื่อสัปดาห์ที่แล้วในมูลค่า $1.57B ซึ่งเป็นหนึ่งในห้าการซื้อที่ใหญ่ที่สุดที่บริษัทเคยทำ
ได้รับแรงบันดาลใจจากข่าวการเข้ารหัสลับที่มีแนวโน้มขึ้น ตลาดที่กว้างขึ้นก็ติดตามการนำของสิ่งนี้เช่นกัน เมื่อ BTC ดันเข้าไปในความต้านทานหลัก และ SOL
CaptainAltcoin9 ชั่วโมง ที่แล้ว
