Trade
Trading Type
Spot
Trade crypto freely
Alpha
Points
Get promising tokens in streamlined on-chain trading
Pre-Market
Trade new tokens before they are officially listed
Margin
Magnify your profit with leverage
Convert & Block Trading
0 Fees
Trade any size with no fees and no slippage
Leveraged Tokens
Get exposure to leveraged positions simply
Futures
Futures
Hundreds of contracts settled in USDT or BTC
Options
HOT
Trade European-style vanilla options
Unified Account
Maximize your capital efficiency
Demo Trading
Futures Kickoff
Get prepared for your futures trading
Futures Events
Participate in events to win generous rewards
Demo Trading
Use virtual funds to experience risk-free trading
Earn
Launch
CandyDrop
Collect candies to earn airdrops
Launchpool
Quick staking, earn potential new tokens
HODLer Airdrop
Hold GT and get massive airdrops for free
Launchpad
Be early to the next big token project
Alpha Points
NEW
Trade on-chain assets and enjoy airdrop rewards!
Futures Points
NEW
Earn futures points and claim airdrop rewards
Investment
Simple Earn
Earn interests with idle tokens
Auto-Invest
Auto-invest on a regular basis
Dual Investment
Buy low and sell high to take profits from price fluctuations
Soft Staking
Earn rewards with flexible staking
Crypto Loan
0 Fees
Pledge one crypto to borrow another
Lending Center
One-Stop Lending Hub
VIP Wealth Hub
Customized wealth management empowers your assets growth
Private Wealth Management
Customized asset management to grow your digital assets
Quant Fund
Top asset management team helps you profit without hassle
Staking
Stake cryptos to earn in PoS products
BTC Staking
HOT
Stake BTC and earn 10% APR
GUSD Minting
Use USDT/USDC to mint GUSD for treasury-level yields
More


ZANEROOK
No content yet
ZANEROOK
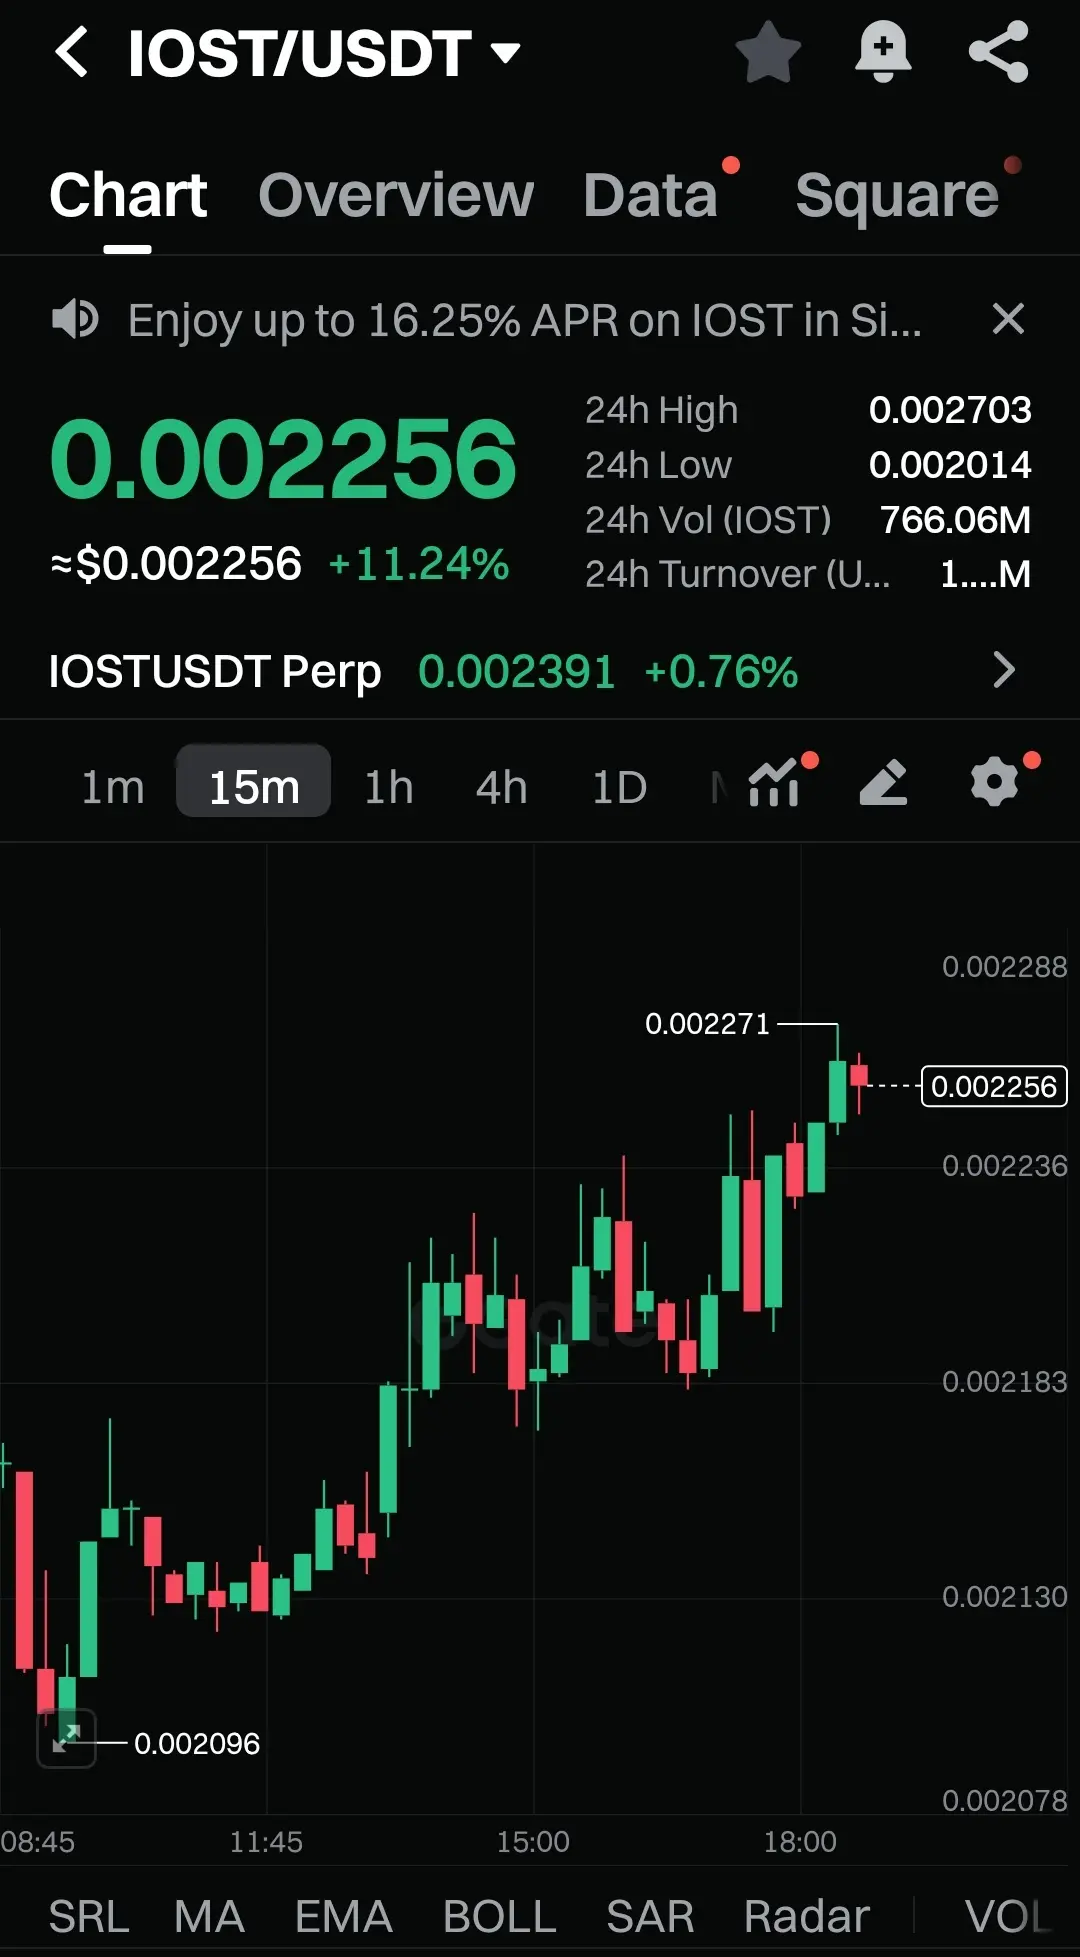
$IOST Just Broke Its Sleep And Buyers Are Turning Up The Heat
I’m watching IOST climb with clean strength on the 15m chart. After dipping into the 0.00209 zone, buyers stepped in and never let it fall back. The candles started stacking higher, volume increased, and now price is pushing around 0.00225 with a fresh wick into 0.00227. That’s a solid sign that momentum is building.
The structure is bullish. Higher lows are holding tight. Every pullback gets bought fast. If IOST keeps defending this base, the next breakout can move quickly toward the upper resistance levels.
Trade Setup
Entry Zo
IOST8.28%
- Reward
- like
- Comment
- Repost
- Share
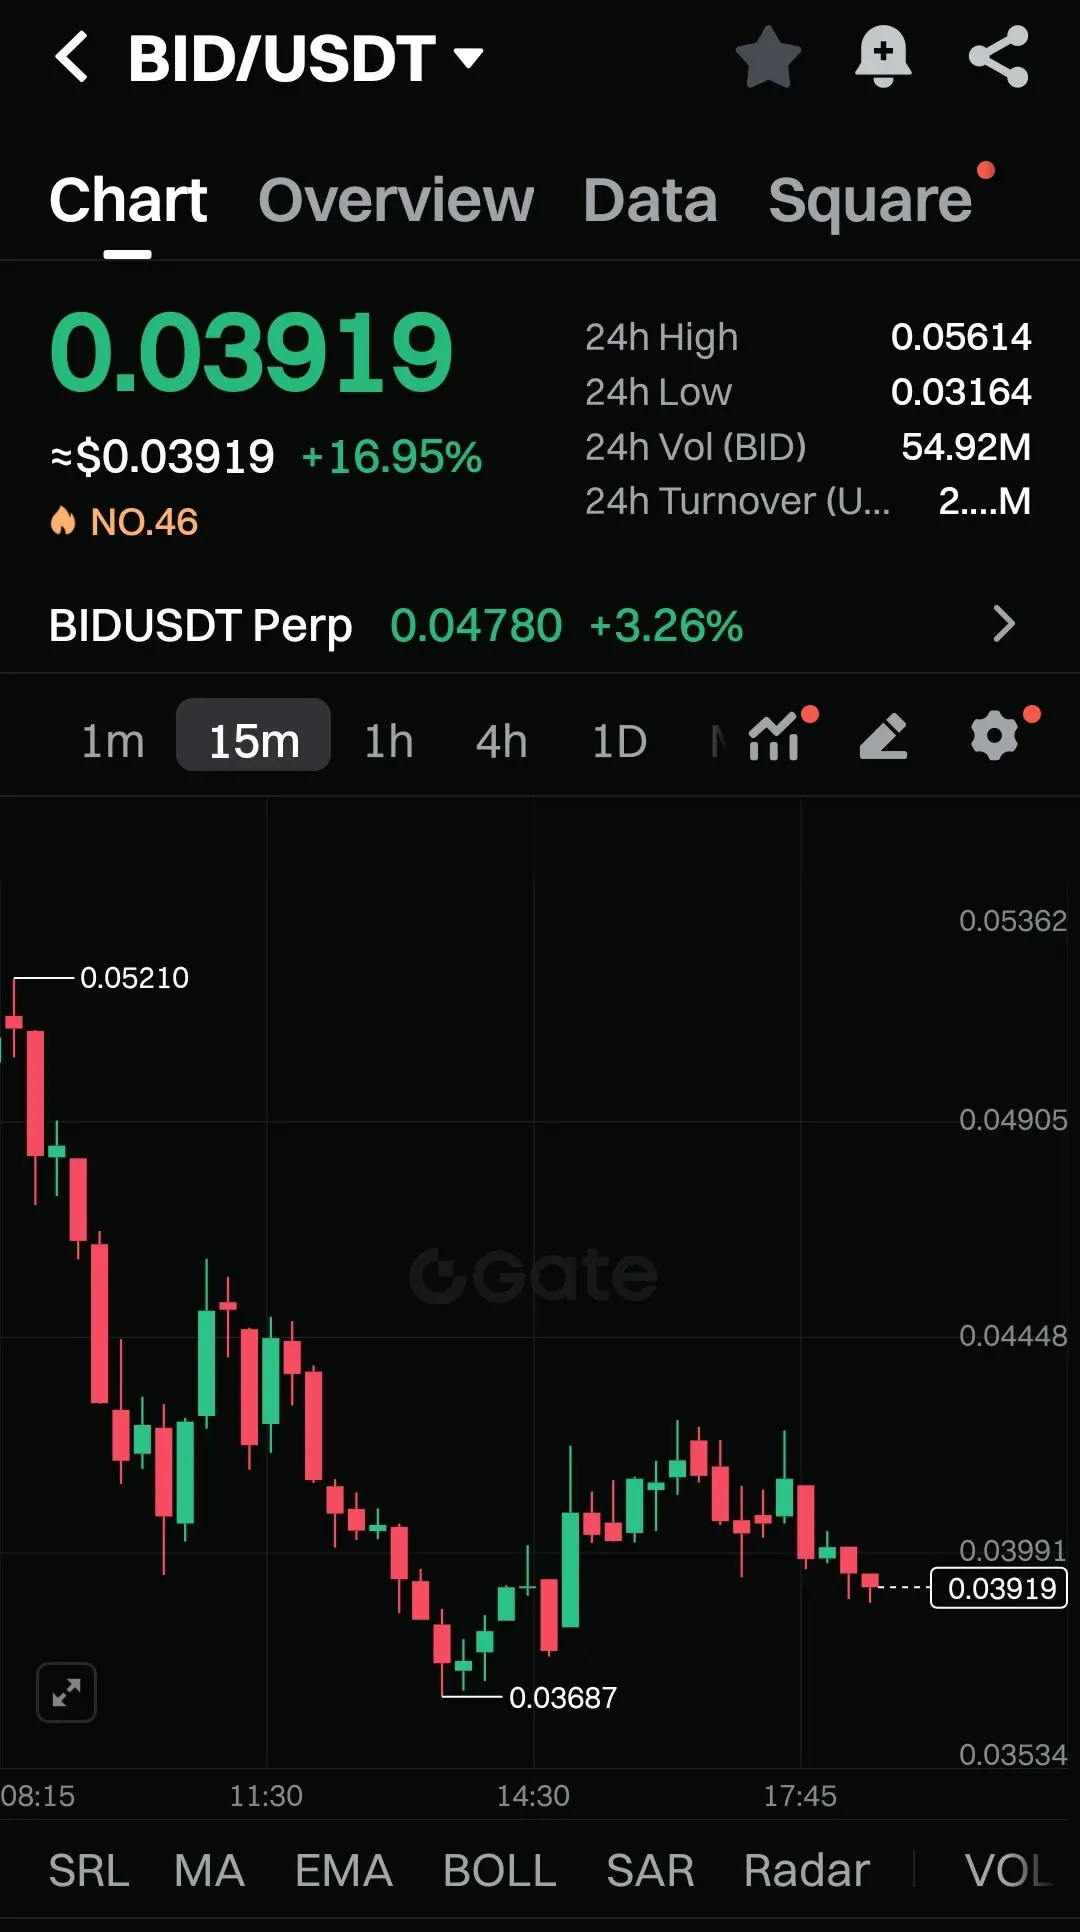
$BID Just Snapped Out Of The Dip And Buyers Are Quietly Taking Control
I’m watching BID recover after that deep slide from the 0.052 zone. Price finally bottomed at 0.0368, and the reaction from that level tells you buyers were waiting. Since then the 15m chart shows slow but steady climbing candles, holding higher lows and trying to build a fresh base around 0.039.
That shift in structure is important. Downtrend pressure is losing strength, and if BID holds this zone a breakout toward the mid-range levels can form fast.
Trade Setup
Entry Zone: 0.0389 – 0.0395
TP1: 0.0408
TP2: 0.0426
TP3: 0
BID-22.32%
- Reward
- like
- Comment
- Repost
- Share
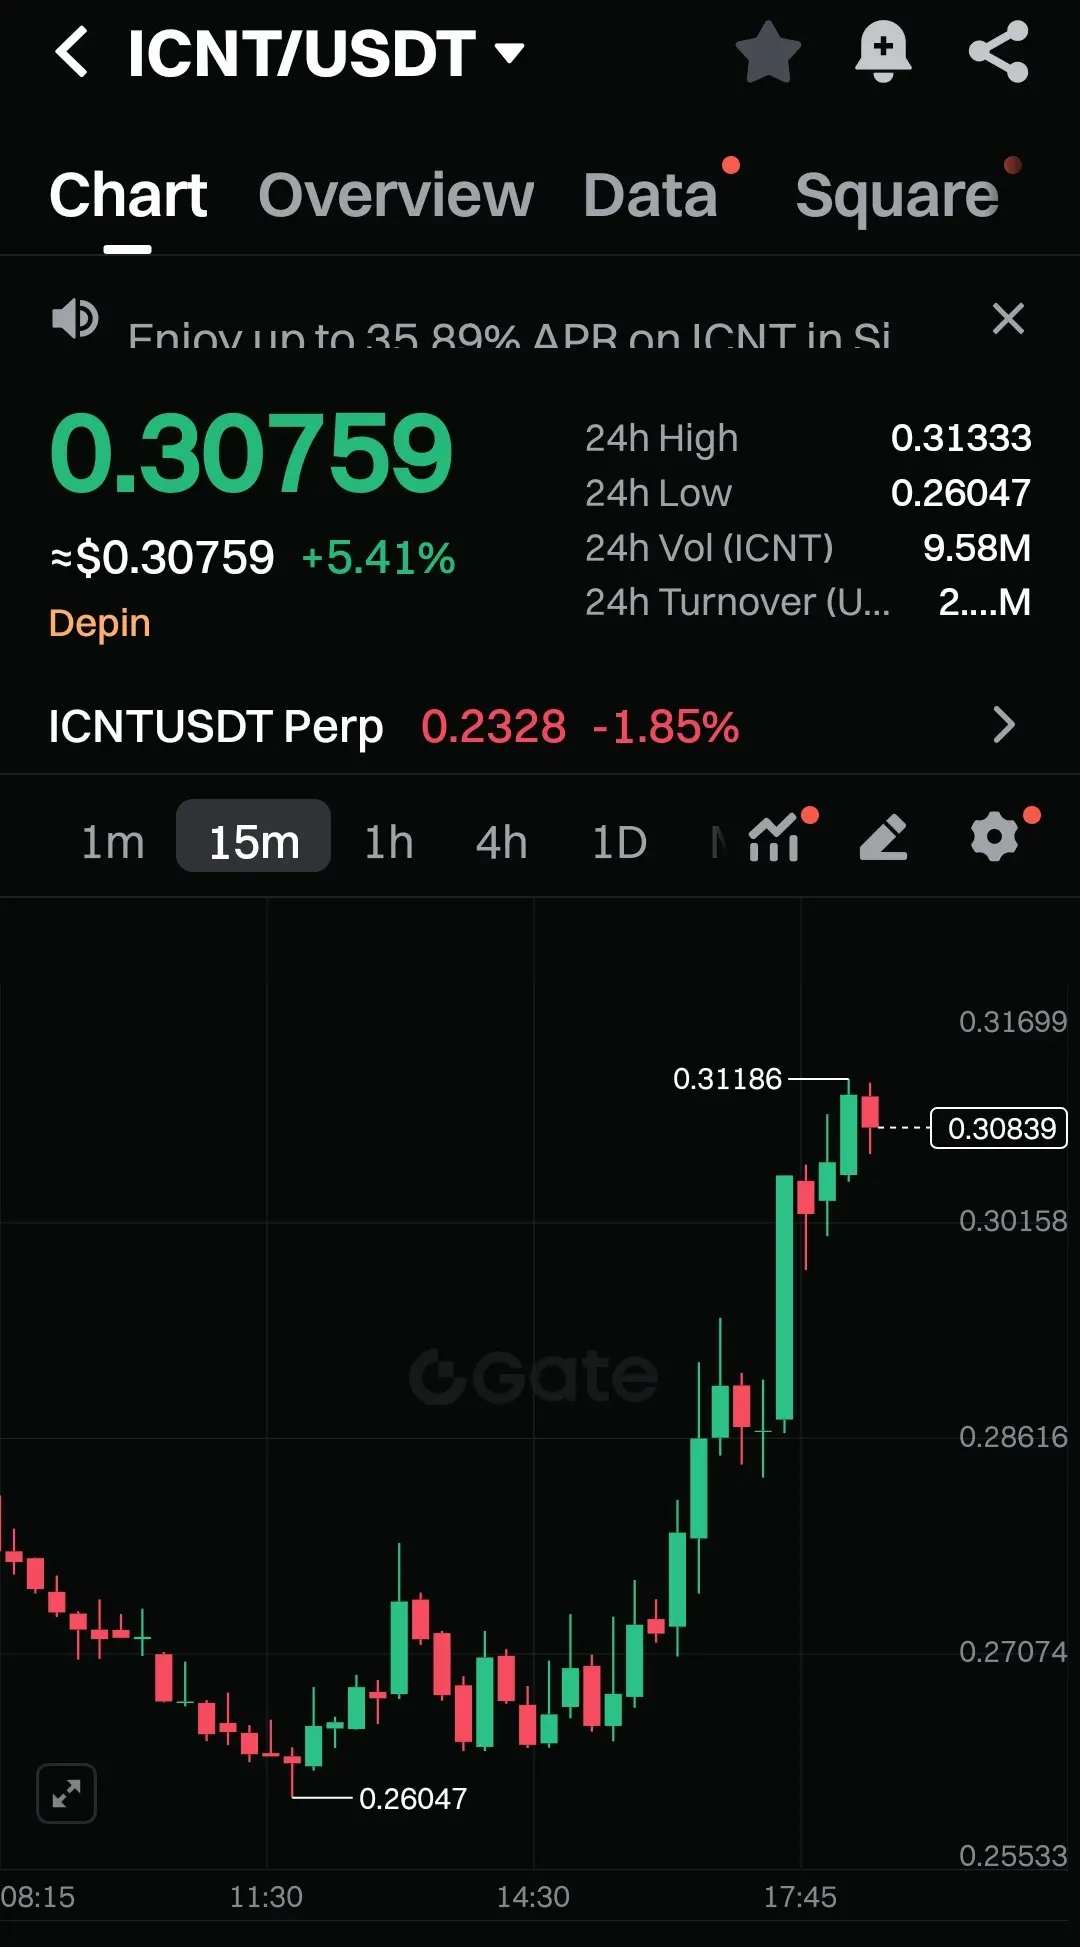
$ICNT Just Exploded Out Of Its Base And Buyers Are Not Slowing Down
I’m watching ICNT flip from weakness to full power. Price found its bottom around 0.260 and from there buyers took complete control. The 15m chart shows a clean stair-step climb until it ripped straight into 0.3118. That breakout wick tells you interest is real and momentum is alive.
Right now ICNT is holding around 0.308, and every small dip is getting eaten fast. If this base stays firm, another push toward the highs can trigger straight continuation.
Trade Setup
Entry Zone: 0.3030 – 0.3085
TP1: 0.3145
TP2: 0.3222
TP3: 0.
ICNT0.64%
- Reward
- like
- Comment
- Repost
- Share
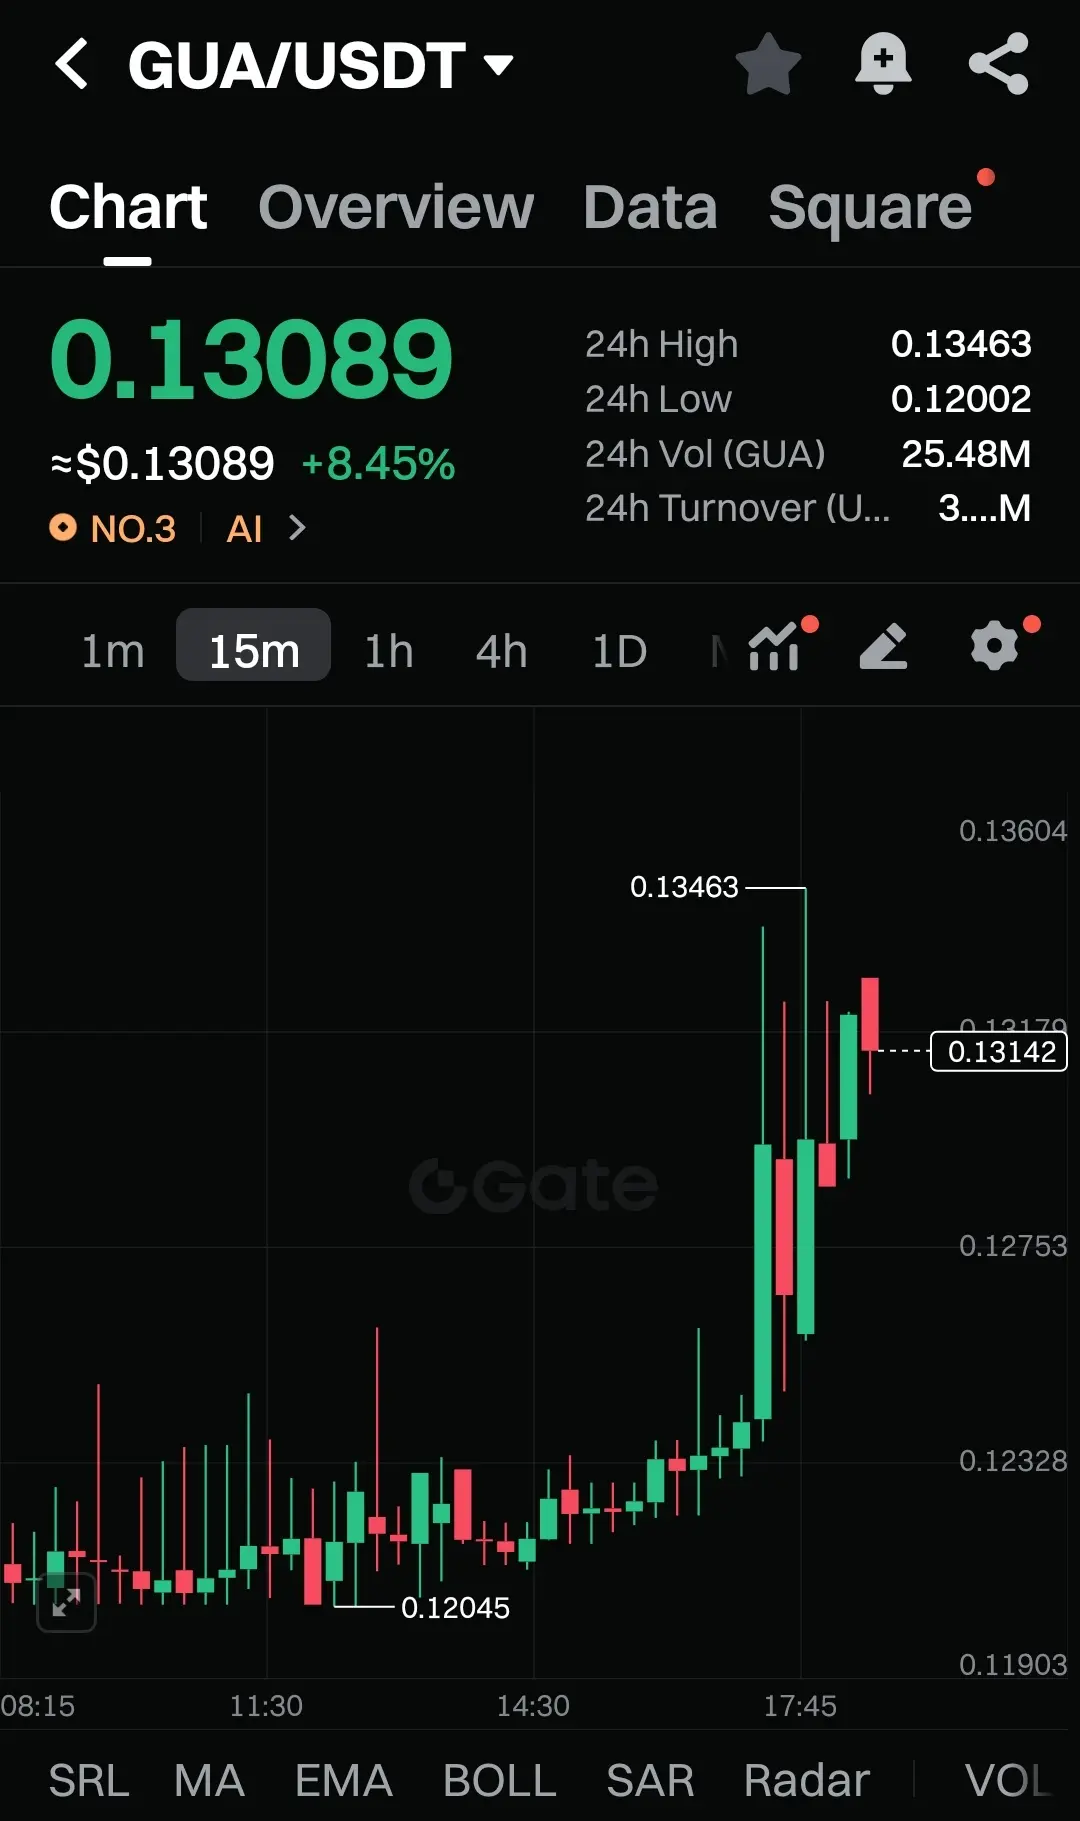
$GUA A Just Ignited A Fresh Breakout Wave
I’m watching GUA fire up with clean momentum on the 15m chart. Price held the 0.120 zone perfectly, then buyers stepped in with force and pushed it straight toward 0.1346. That breakout wick shows real demand, not random noise. Every dip since then is getting absorbed fast and the structure is climbing with confidence.
Right now GUA is sitting around 0.131 with buyers still active. If this base holds, the next push can take it right back into the highs.
Trade Setup
Entry Zone: 0.1300 – 0.1315
TP1: 0.1348
TP2: 0.1382
TP3: 0.1425
Stop Loss: 0.1280
Stro
GUA0.24%
- Reward
- like
- 1
- Repost
- Share
Luanander :
:
45 usdt$MYX Just Had A Monster Run And Now It’s Cooling For The Next Move
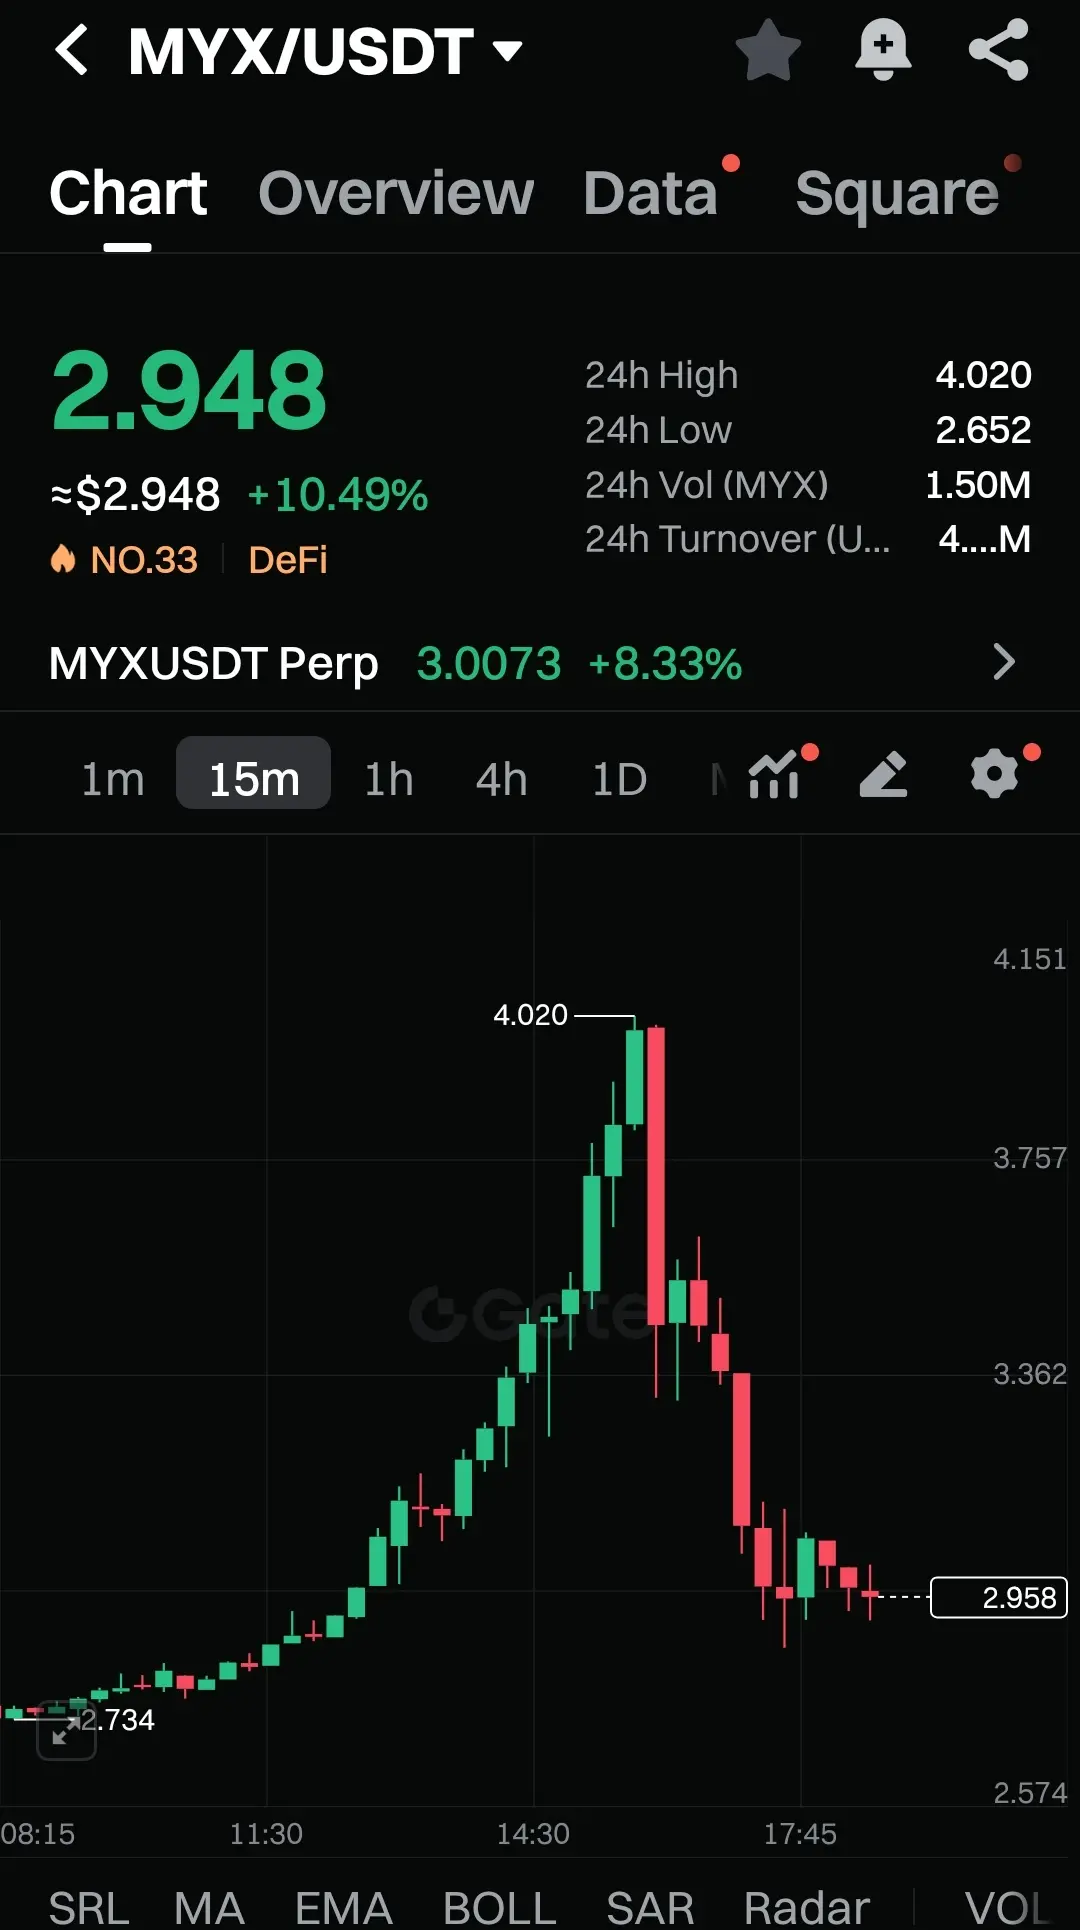
I’m watching MYX after that explosive push to 4.020. The rally was clean, violent, and full of buyer momentum. After hitting the peak, profit-taking kicked in fast and dragged price back to the 2.95 zone where it’s now trying to stabilize. This is the exact spot where strong coins either die or reset for another wave.
Right now MYX is printing steady candles, holding the pullback without losing structure. If buyers defend this base, we can see a sharp rebound because volatility is still high and interest is not fading.
Trade
MYX1.43%
- Reward
- like
- 1
- Repost
- Share
GateUser-e2395d2b :
:
You have set a stop loss.$XAUT USDT Just Flipped Into Pure Strength
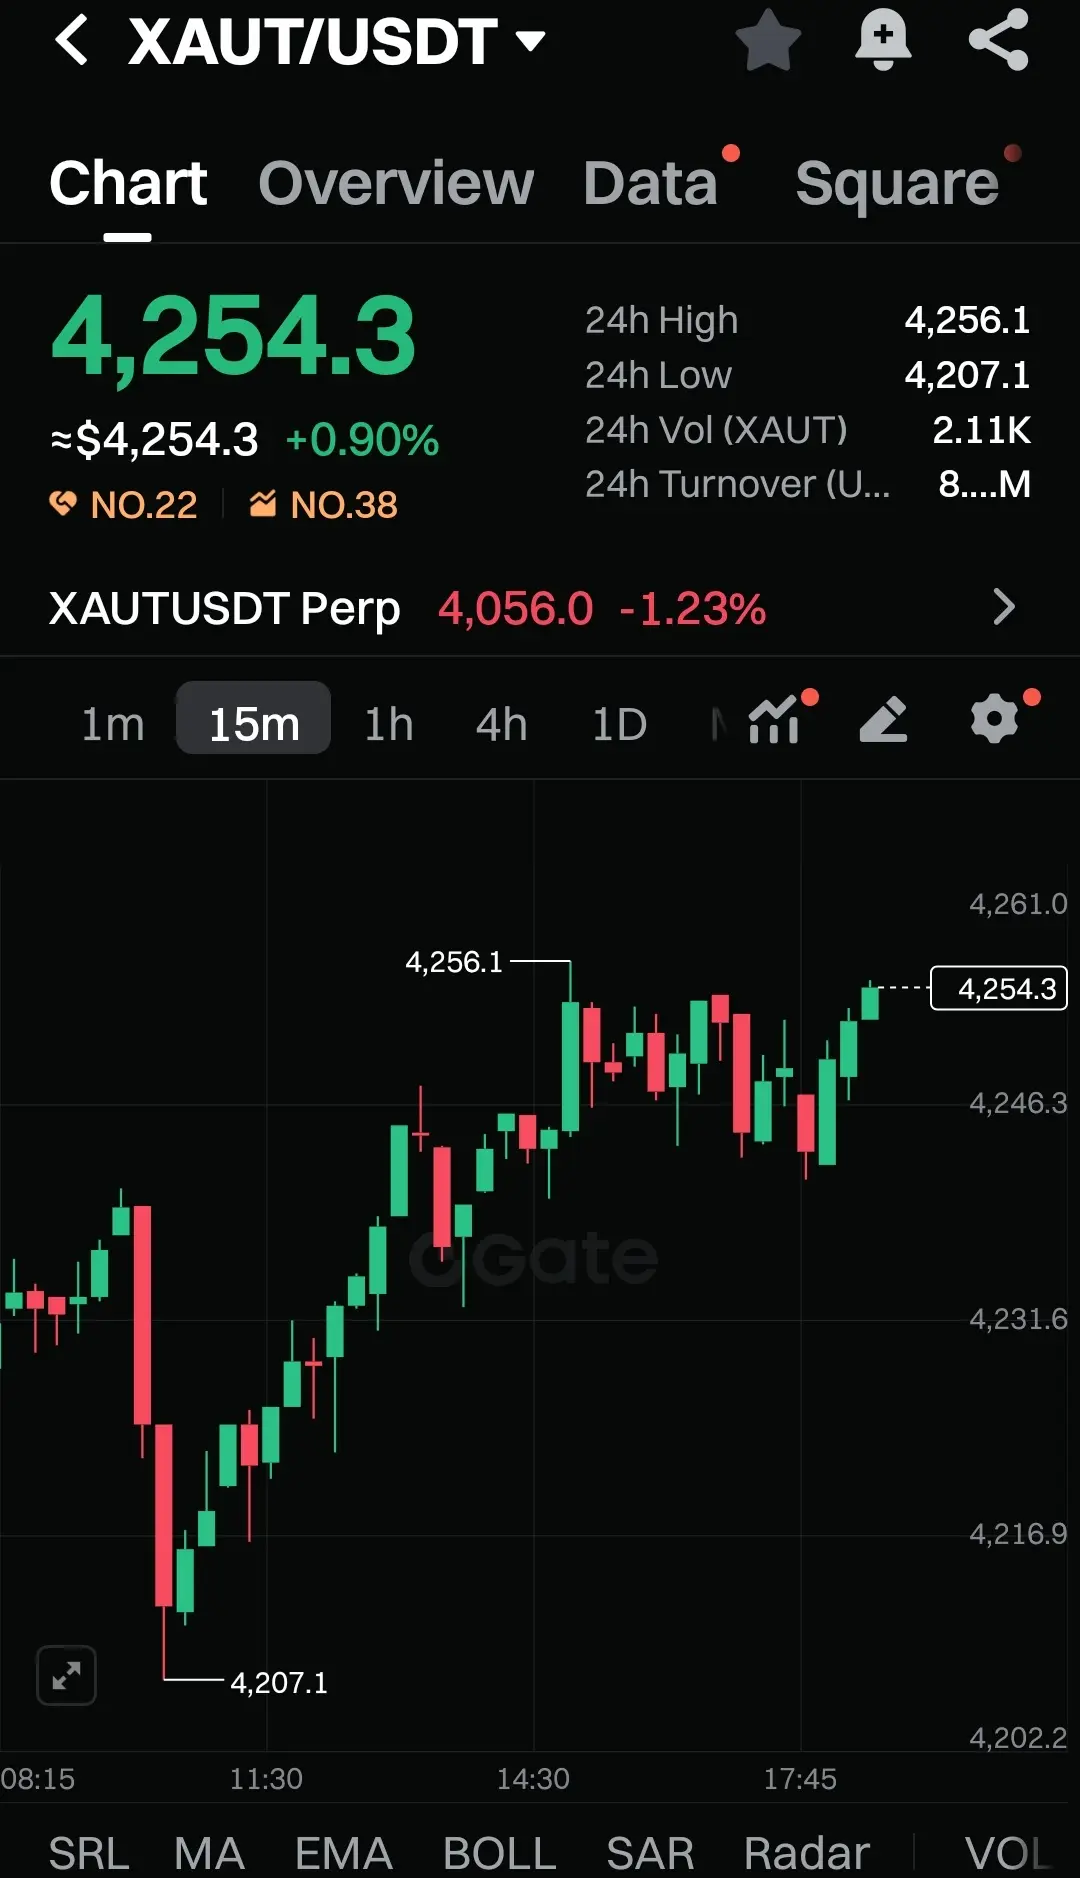
I’m watching gold on-chain wake up with real momentum. After tapping the 4207 zone earlier, buyers stepped in hard and never looked back. Every dip on the 15m chart is getting absorbed, and now price is pushing right into the 4254 area with steady confidence. This is classic controlled bullish pressure.
Candles are clean. Higher lows are forming. Momentum is rising without hesitation. If buyers keep defending this base, the next extension can break the intraday high at 4256 and open more upside.
Trade Setup
Entry Zone: 4246 – 4254
TP1: 4262
TP2: 427
XAUT0.26%
- Reward
- like
- Comment
- Repost
- Share
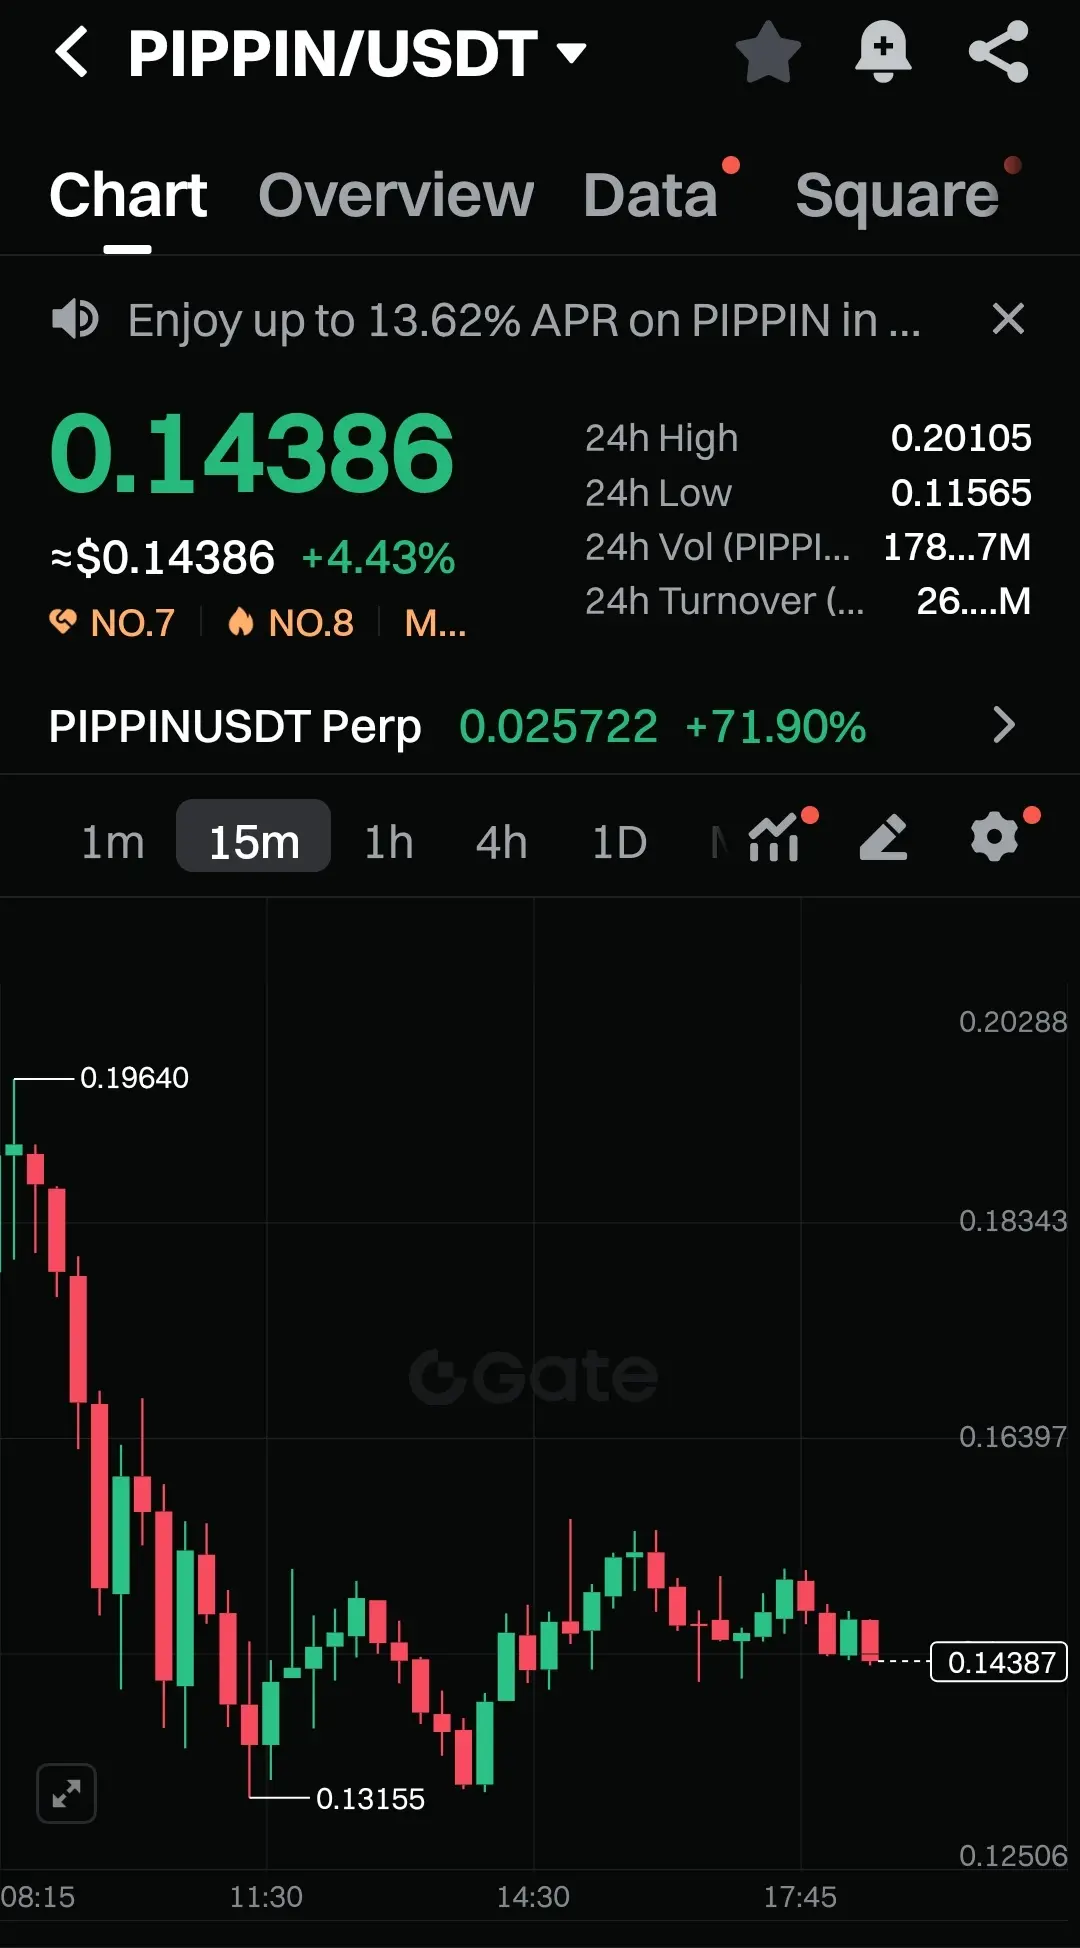
$PIPPIN Just Woke Up After A Heavy Drop
I’m watching this chart flip its mood after sliding down from the 0.196 zone. Price finally found footing at 0.1315, and that bounce showed real strength. Since then PIPPIN has been slowly climbing, printing healthier candles and holding steady above the short-term support. That shift usually marks the start of a recovery phase.
Right now the 15m structure is stabilizing. Buyers are trying to build a base at 0.143 and if this zone holds, the next push can hit fast because volatility is still high from the earlier dump.
Trade Setup
Entry Zone: 0.1415 –
PIPPIN28.01%
- Reward
- 1
- Comment
- Repost
- Share
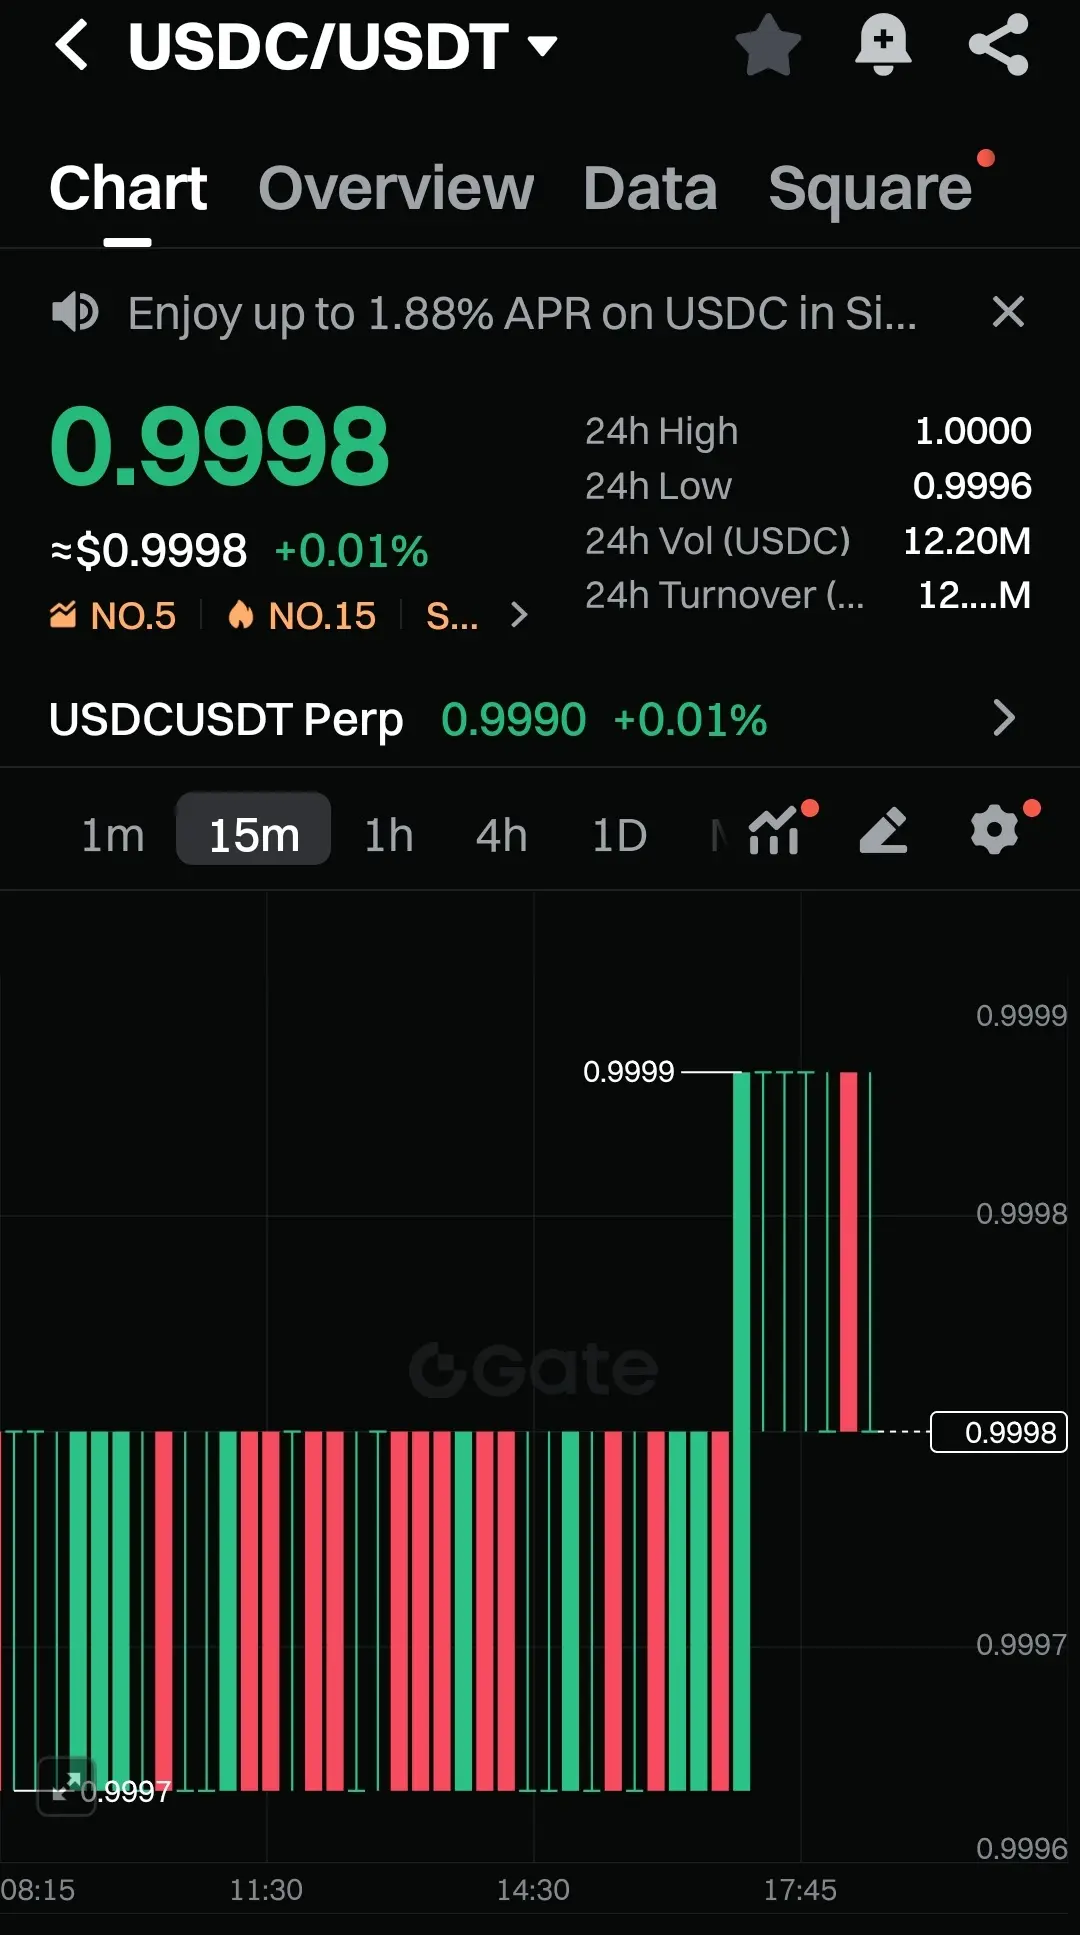
$USDC Just Gave A Tiny But Clean Pulse
I’m watching this stable pair flip a neat micro-push on the 15m chart. Price tapped 0.9996 then climbed right back to 0.9999, showing a clear reclaim with steady buying behind it. Even in a tight range like this, these small jumps reveal where liquidity is leaning.
Right now buyers are defending every dip and pushing price toward parity again. If the 0.9998 zone keeps holding, we might see another quick test into 1.0000.
Quick Setup View
Entry Zone: 0.9996 – 0.9998
TP1: 0.9999
TP2: 1.0000
Stop Loss: 0.9994
Clean chart. Strong defense. Stable strength b
USDC-0.02%
- Reward
- like
- Comment
- Repost
- Share
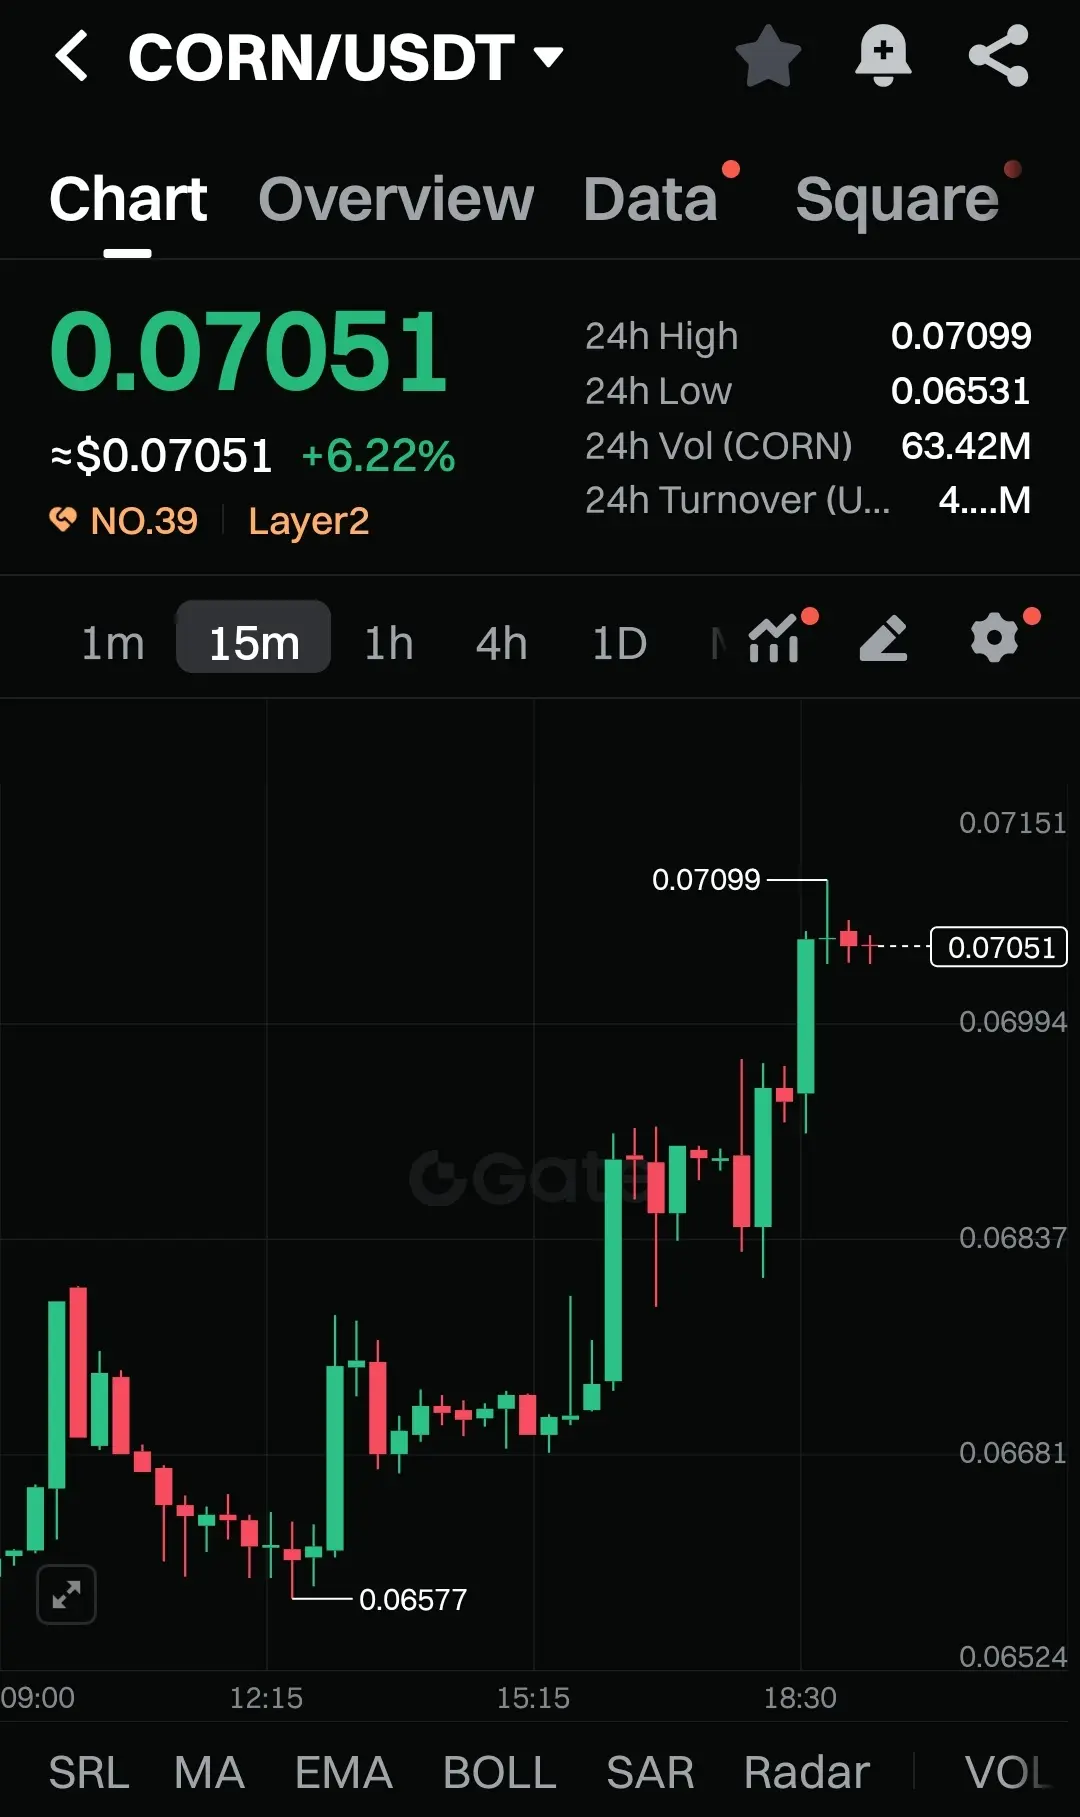
$CORN Just Fired Up With a Clean Breakout!
I’m watching $CORN push straight from 0.06577 into a fresh high at 0.07099, and the way it’s holding above 0.070 shows buyers are fully locked in. Momentum is strong, dips are tiny, and the 15m candles look ready for another leg.
Entry Zone: 0.06980 – 0.07030
Targets:
TP1: 0.07150
TP2: 0.07280
TP3: 0.07450
Stop-Loss: 0.06840
Structure is bullish, volume is building, and the breakout base is solid.
If $CORN pushes back above 0.0710, the next move can hit fast.
I’m watching this closely — the chart feels explosive. #JoinGrowthPointsDrawToWiniPhone17
CORN-4.51%
- Reward
- like
- Comment
- Repost
- Share
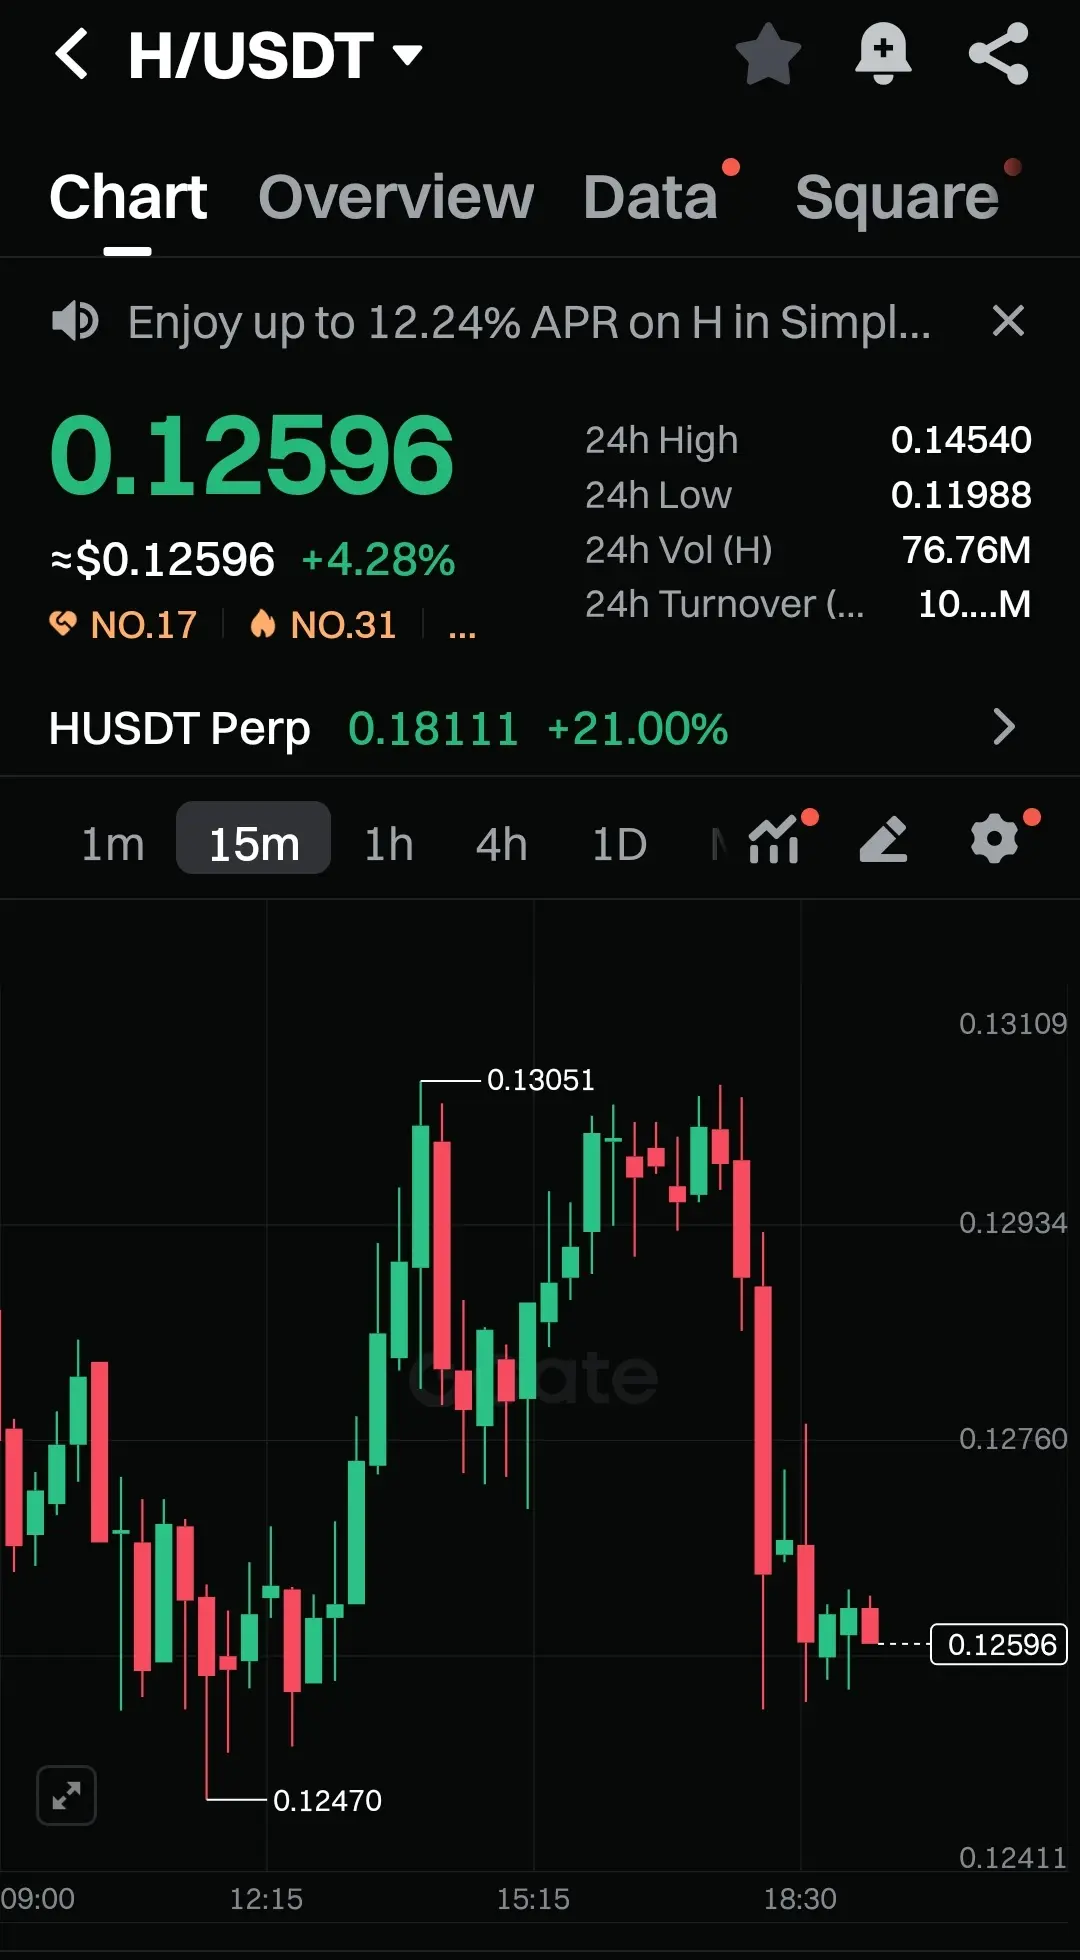
$H Just Flipped Momentum Again!
I’m watching $H bounce cleanly from 0.12470 and push straight into 0.13051, showing buyers still have strength even after that heavy pullback. The chart is holding above key support, and the candles are stabilizing for the next move.
Entry Zone: 0.12500 – 0.12620
Targets:
TP1: 0.12880
TP2: 0.13050
TP3: 0.13320
Stop-Loss: 0.12380
Structure is still bullish on the 15m. If $H reclaims 0.1280 again, momentum can fire up fast.
I’m watching this closely — another upward burst can come any moment. #JoinGrowthPointsDrawToWiniPhone17 #DecemberRateCutForecast #ReboundT
H-5.82%
- Reward
- like
- Comment
- Repost
- Share
$DGRAM Is Heating Up Fast!
I’m watching $DGRAM build a clean base after that sharp spike to 0.006097. Buyers showed real power there, and the chart is now compressing tightly — this usually hints at another quick move coming.
Entry Zone: 0.00570 – 0.00580
Targets:
TP1: 0.00595
TP2: 0.00610
TP3: 0.00628
Stop-Loss: 0.00552
Price is holding steady above support, volume is stable, and the 15m structure still favors upside. If $DGRAM breaks 0.00595 again, momentum can fire instantly.
I’m ready for the next pop — this chart feels charged. #JoinGrowthPointsDrawToWiniPhone17 #DecemberRateCutForecas
DGRAM-24.69%
- Reward
- 1
- 1
- Repost
- Share
MaiLee:
Thank you for this information....$MBG Waking Up With Fresh Momentum!
I’m watching $MBG react beautifully right now. That bounce from 0.4500 straight into 0.4665 shows buyers stepping back with real confidence. Even after the pullback, price is still holding the higher zone — momentum is alive.
Entry Zone: 0.4550 – 0.4590
Targets:
TP1: 0.4660
TP2: 0.4720
TP3: 0.4780
Stop-Loss: 0.4480
Candle structure is clean. Dips are getting picked up. If $MBG reclaims 0.4630 again, the next push can happen fast.
I’m ready for the next burst — this chart looks charged. #JoinGrowthPointsDrawToWiniPhone17 #DecemberRateCutForecast #ReboundTo
MBG5.03%

- Reward
- like
- Comment
- Repost
- Share
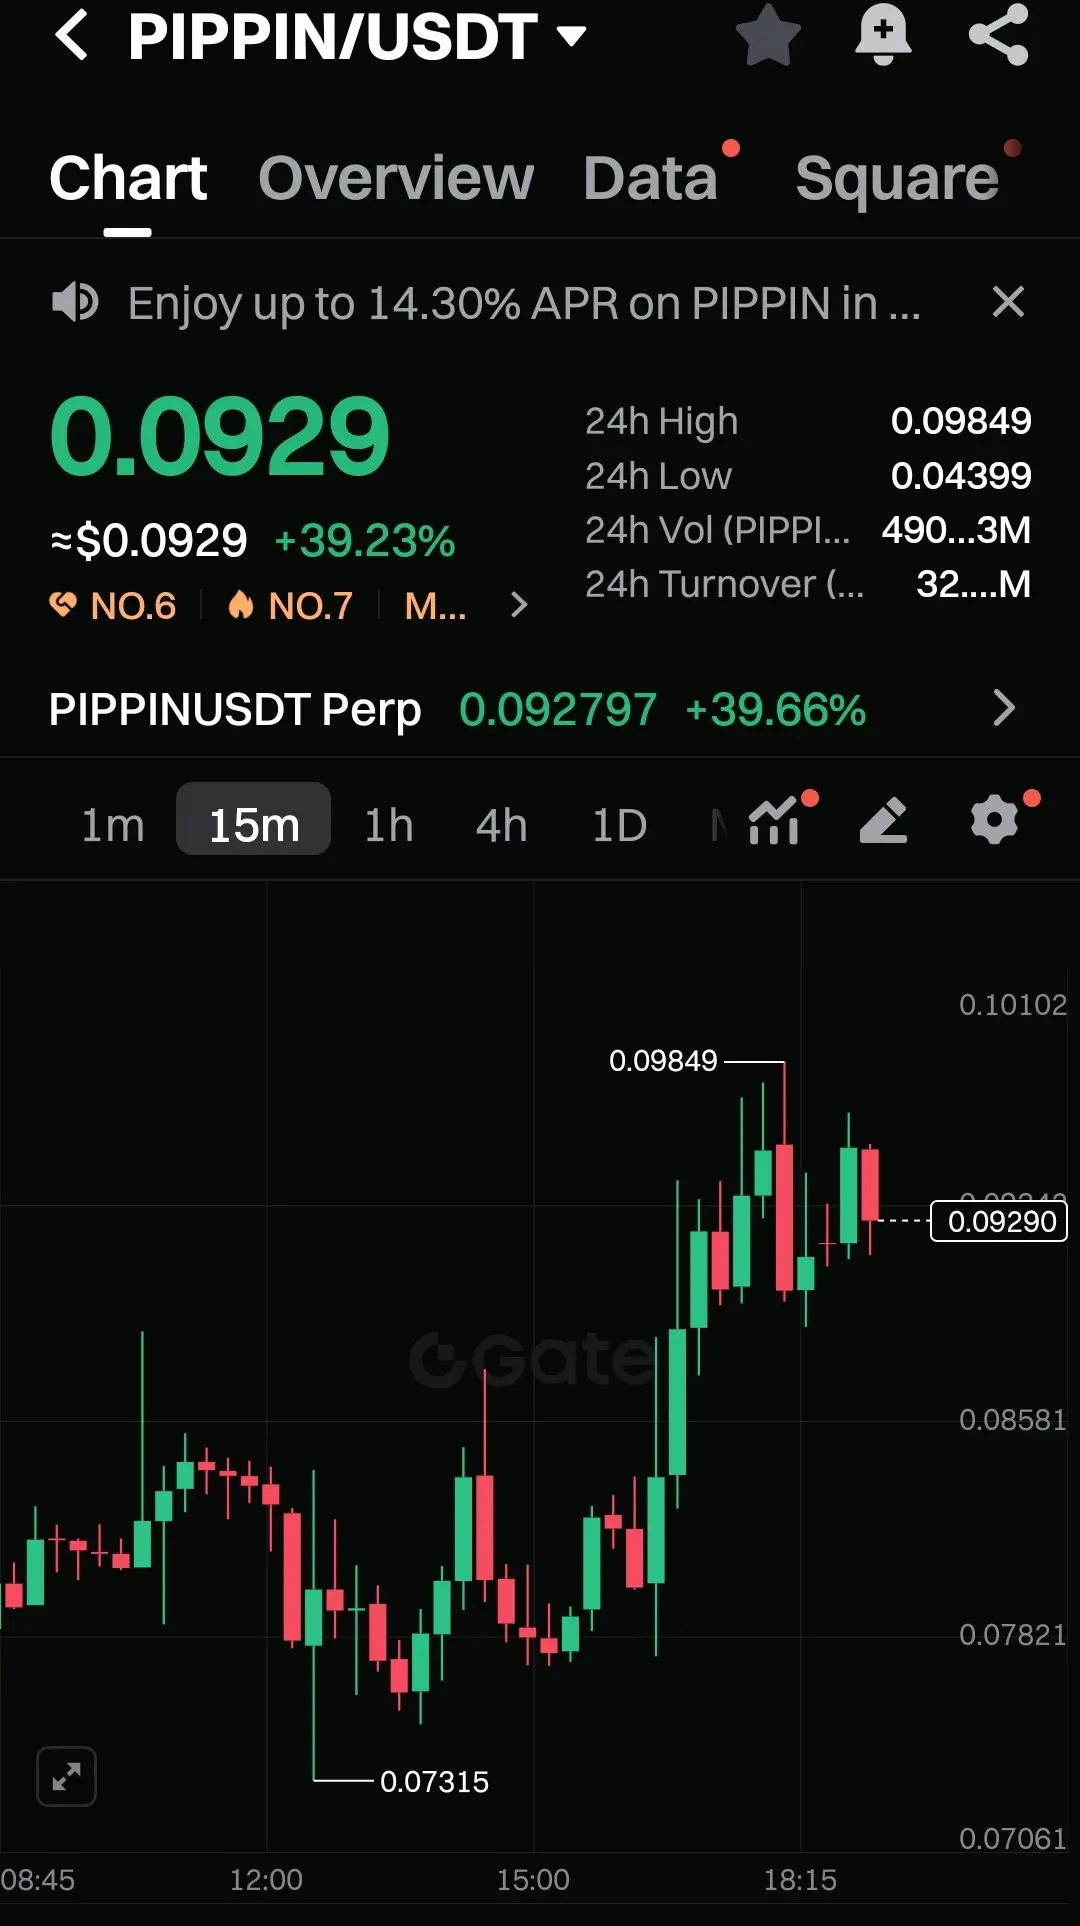
$PIPPIN Just Went Beast Mode!
I’m watching $PIPPIN explode with crazy strength right now. That clean lift from 0.073 straight into 0.09849 shows one thing — buyers are in full control and momentum is still hot. The 15m candles are holding firm above support, and dips are getting eaten instantly.
Entry Zone: 0.08950 – 0.09150
Targets:
TP1: 0.09780
TP2: 0.10120
TP3: 0.10550
Stop-Loss: 0.08700
This move is alive. Volume is building. Price is holding.
If $PIPPIN clears the 0.098 zone again, the next push can come fast.
I’m ready for the next leg up — this chart looks electric. #JoinGrowthPoints
PIPPIN28.01%
- Reward
- like
- Comment
- Repost
- Share
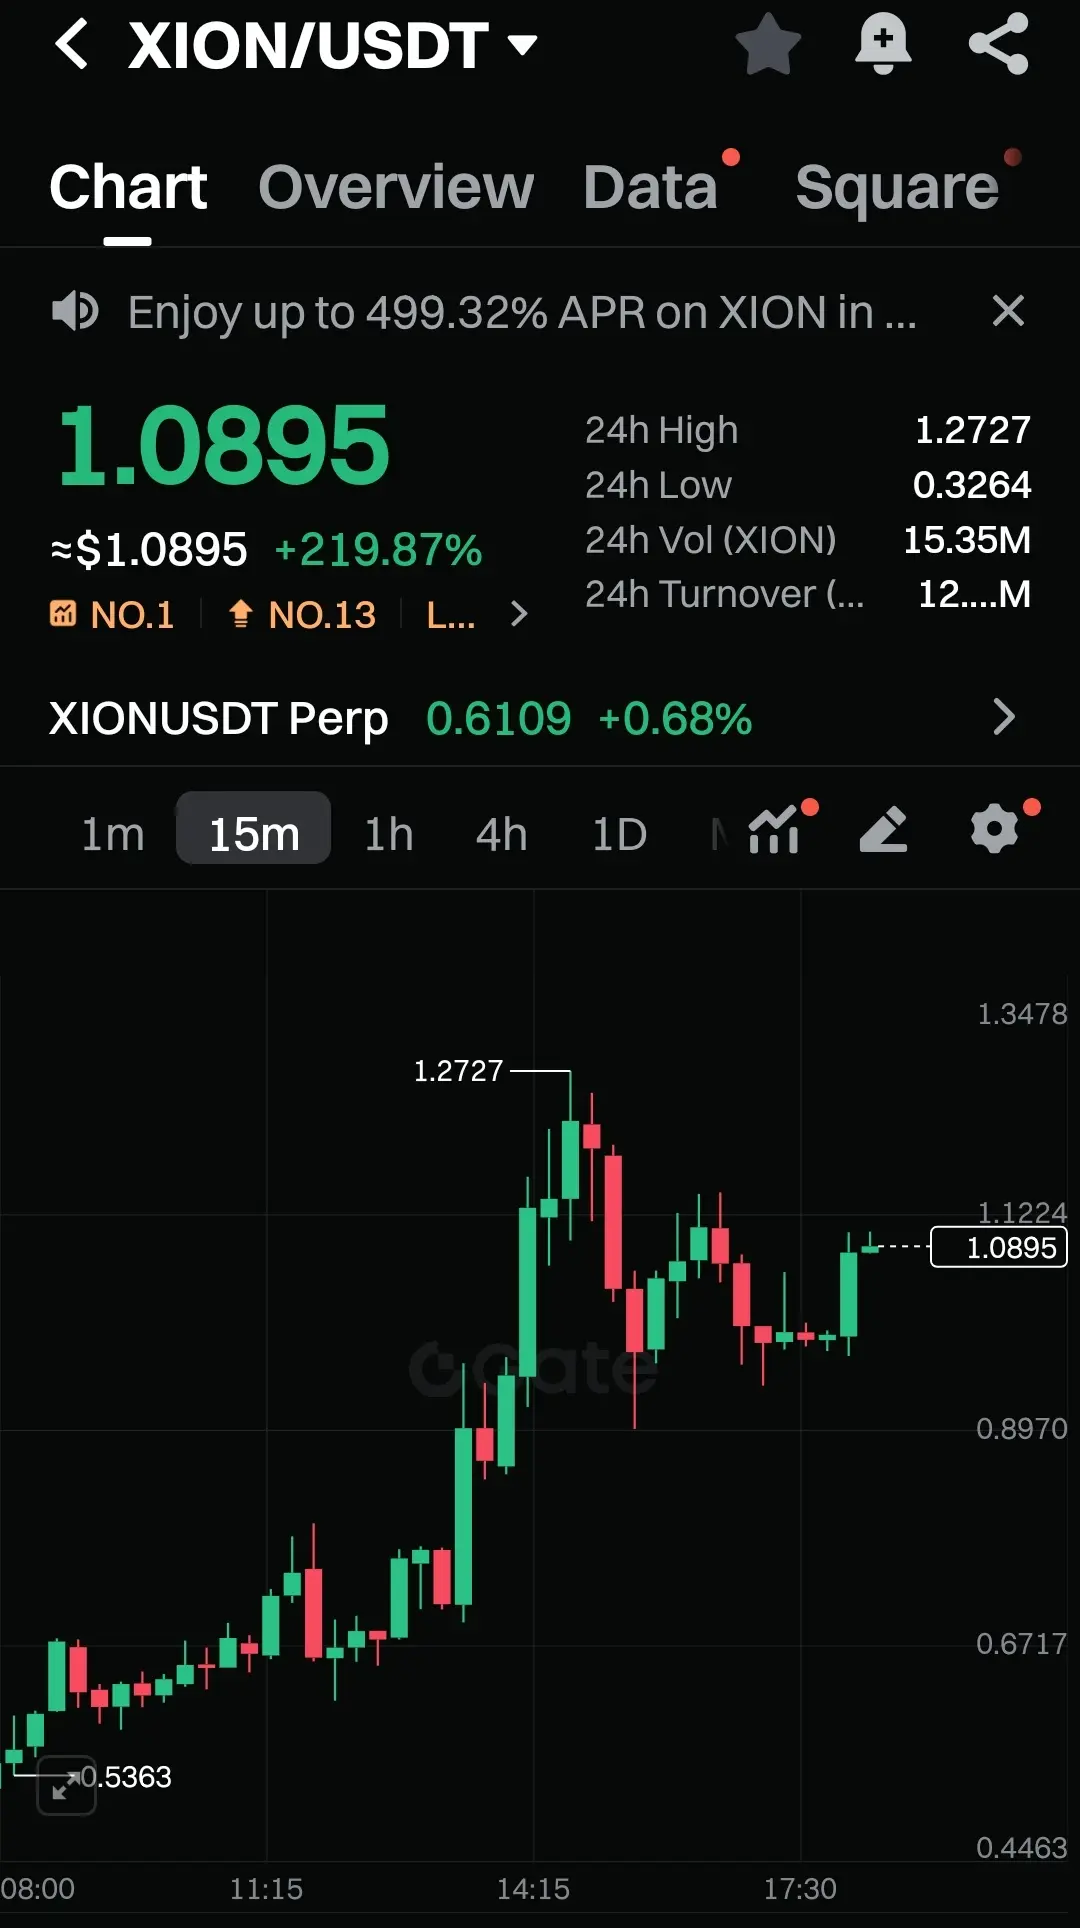
$XION / USDT Is Going Wild Today
Price is blasting at 1.0895, up more than 219 percent, and the chart is showing explosive momentum after that crazy run from the 0.3264 low all the way to the 1.2727 high.
This pullback looks healthy — nothing broken. Buyers are still in full control.
Right now price is reclaiming levels near 1.1224, showing strength after the dip, and every candle here feels like it’s preparing for the next leg.
If bulls break above 1.1224, the chart could make another attempt toward 1.27.
If price slides back toward 0.8970, watch that zone — it’s the key support holding t
XION-20.31%
- Reward
- like
- Comment
- Repost
- Share
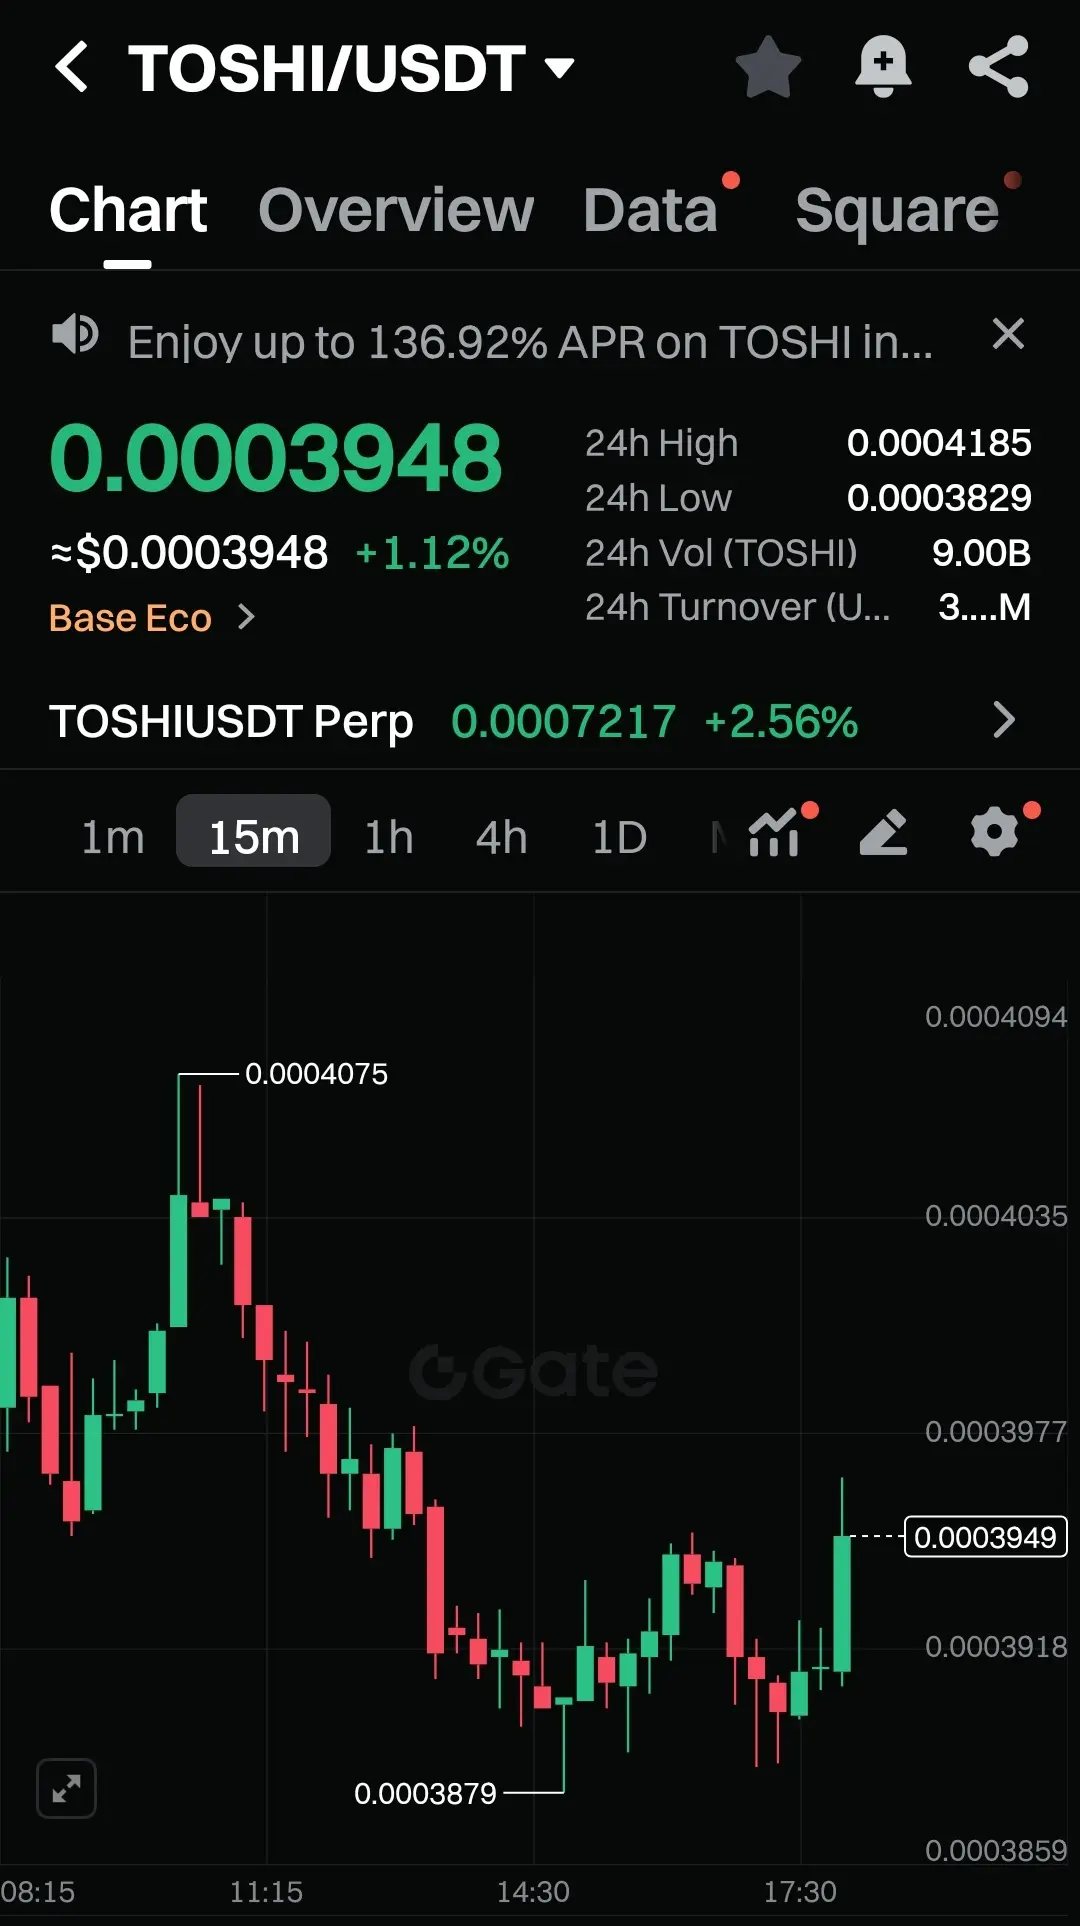
$TOSHI / USDT Just Snapped Back Hard
Price is at 0.0003948, and the chart just printed a clean bounce straight off the 0.0003879 low. That wick shows real demand — buyers stepped in aggressively the moment price tapped liquidity.
Now we’re seeing a strong green push, and momentum is shifting fast.
If bulls break above 0.0003977, the chart opens a path toward 0.0004035 where the next reaction zone sits.
If price dips back toward 0.0003918, watch carefully — that level will decide whether this bounce becomes a full reversal or just a reset.
Volume rising. Candles firing.
This chart is waking
TOSHI-6.11%
- Reward
- 2
- Comment
- Repost
- Share
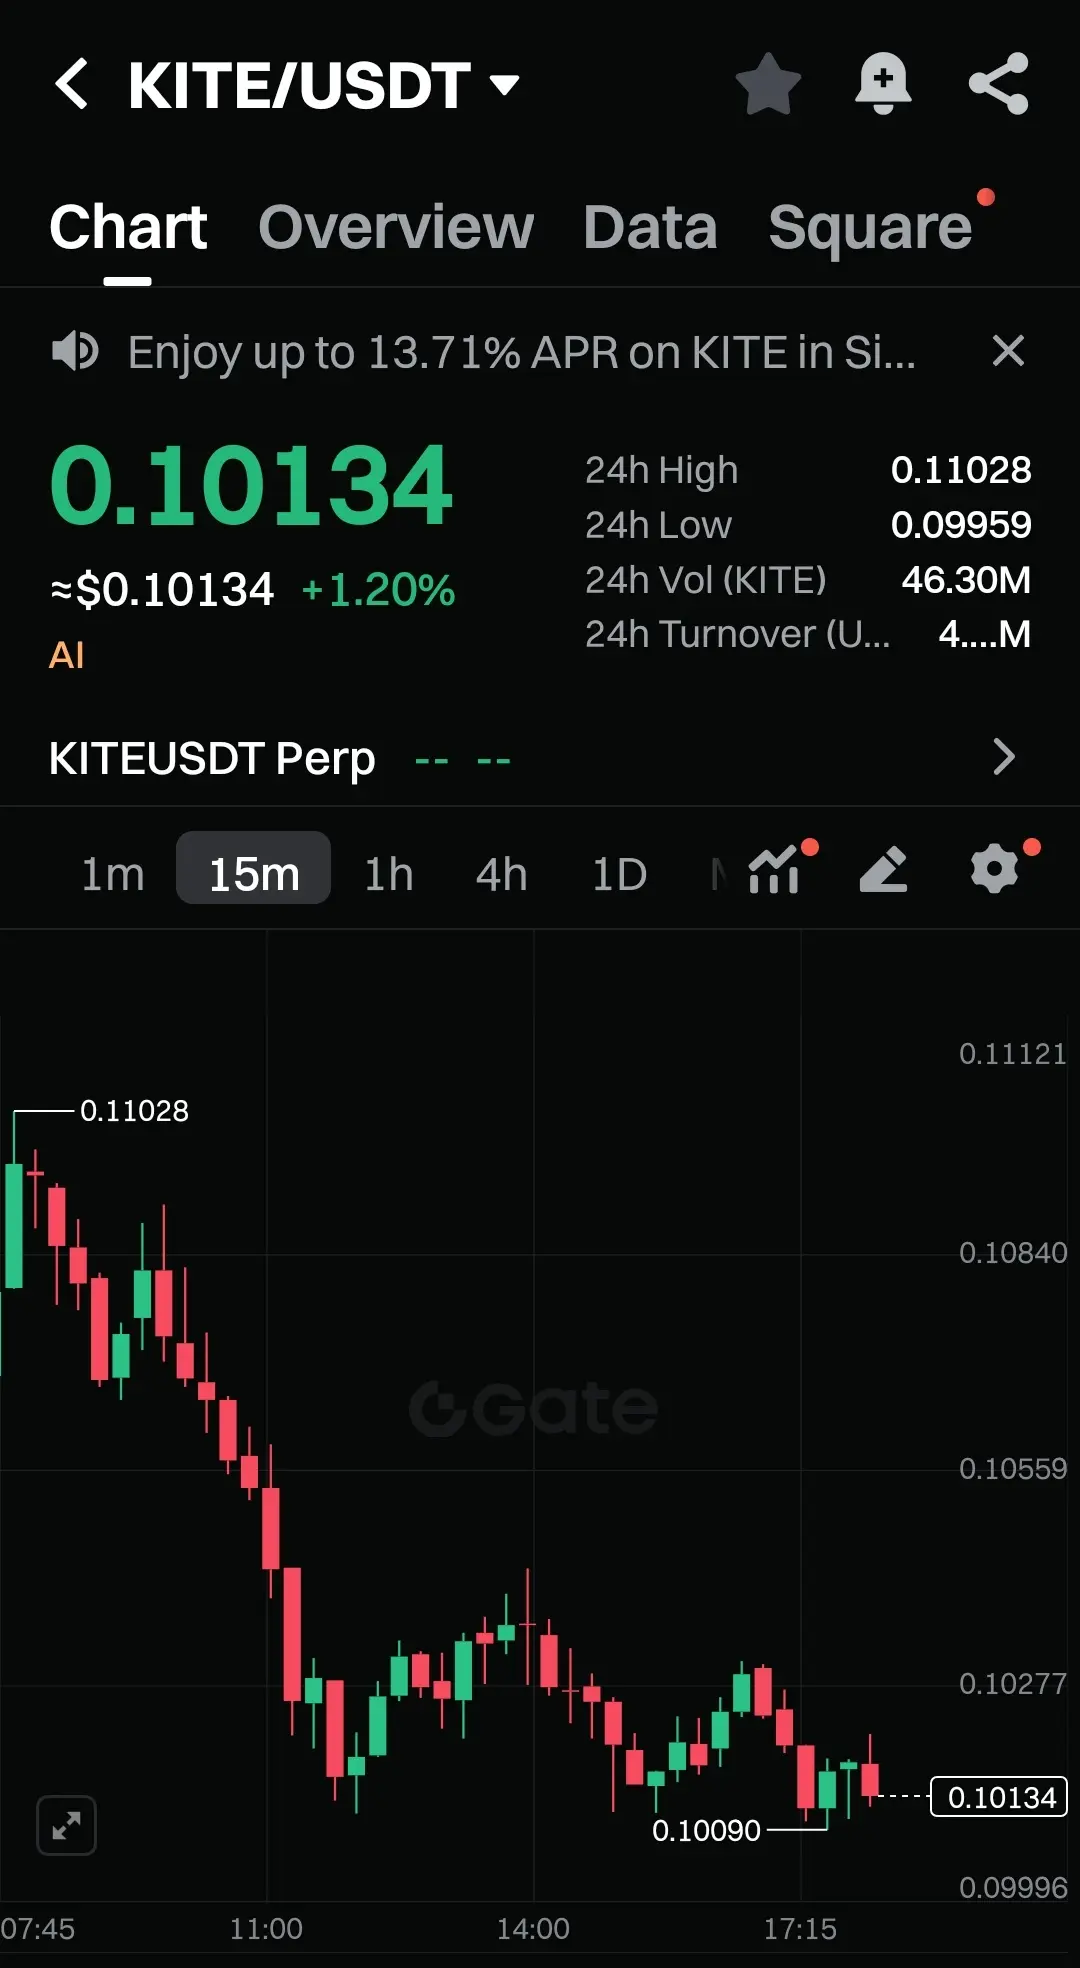
$KITE E / USDT Sitting on a Pressure Point
Price is holding at 0.10134, and the chart is showing a slow but steady fight after that deep drop from the 0.11028 high. Sellers pushed hard earlier, but the reaction from 0.10090 shows buyers are not giving up this zone easily.
I’m watching this level closely… this is exactly where reversals start.
If bulls reclaim 0.10270, momentum flips fast and the chart can open room toward 0.10550.
If price loses 0.10090, the 0.09996 liquidity becomes the next test for stability.
The candles are tight. Volume is low but steady.
This is the calm phase before
KITE-6.6%
- Reward
- like
- Comment
- Repost
- Share
$DIAM / USDT Just Fired Up Again
Price is sitting at 0.011596, and the chart is showing a clean burst of momentum after tapping the 0.011357 low earlier. Buyers came in fast, pushed the candle straight into 0.011650, and now we’re getting a healthy pullback right above support.
This move doesn’t look weak. It looks like energy building for the next leg.
If bulls reclaim 0.011620, the chart opens up for another attack on the 0.011650 high.
If price dips back toward 0.011536, watch for another strong reaction — buyers defended it earlier with confidence.
Volume is rising. Momentum is alive.
DIAM-2.52%
- Reward
- like
- Comment
- Repost
- Share
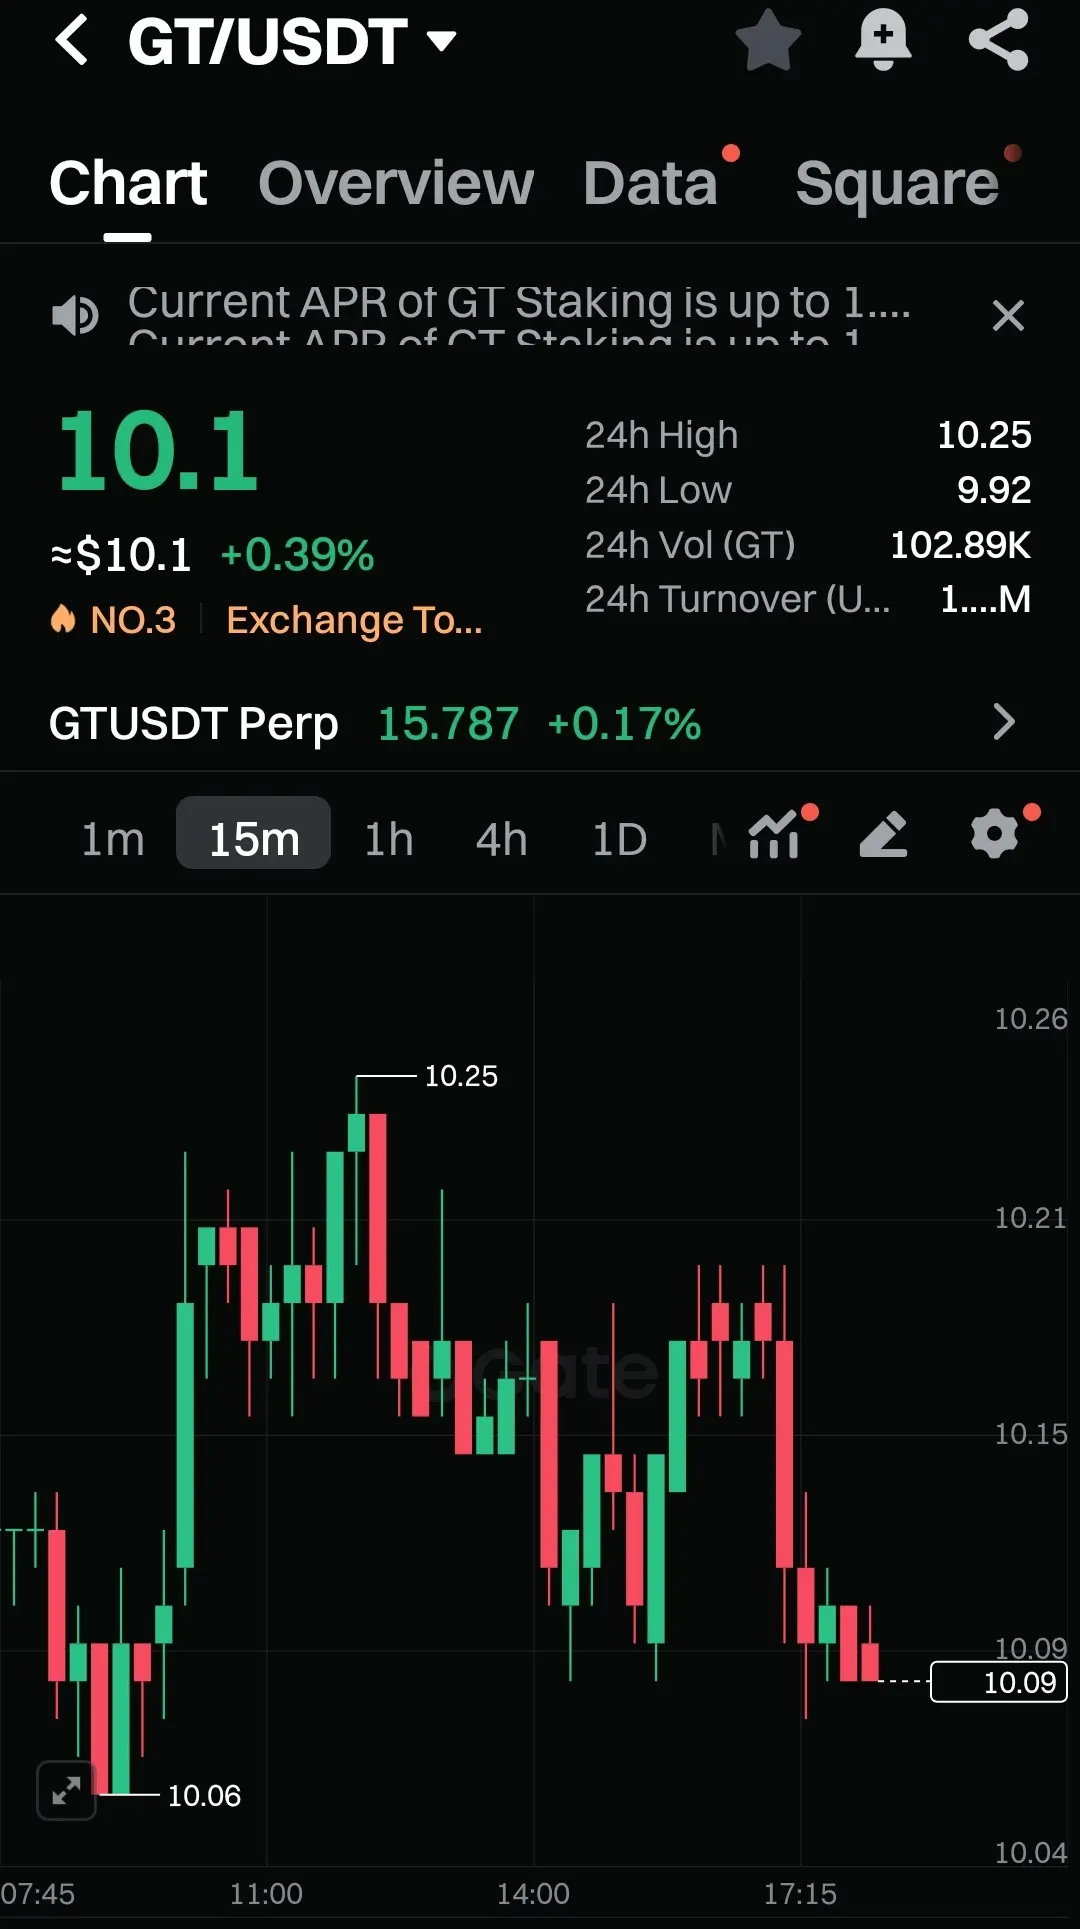
/ $USDT Waking Up Again
Price is hovering around 10.09, and the chart is showing pressure building after a slow bleed from the 10.25 high earlier.
I’m watching this zone closely… every small candle here feels like the market is loading energy for the next move. Buyers defended 10.06 earlier, and the reaction was strong, but now the battle is right at 10.09.
If bulls reclaim 10.15, momentum flips fast.
If price loses 10.06, deeper liquidity below 10.00 gets tested.
The chart is tight. The move is coming. Stay sharp. #GateChristmasGiveaway #NonfarmPayrollsBeatExpectations #ReboundTokenstoWat
- Reward
- like
- Comment
- Repost
- Share
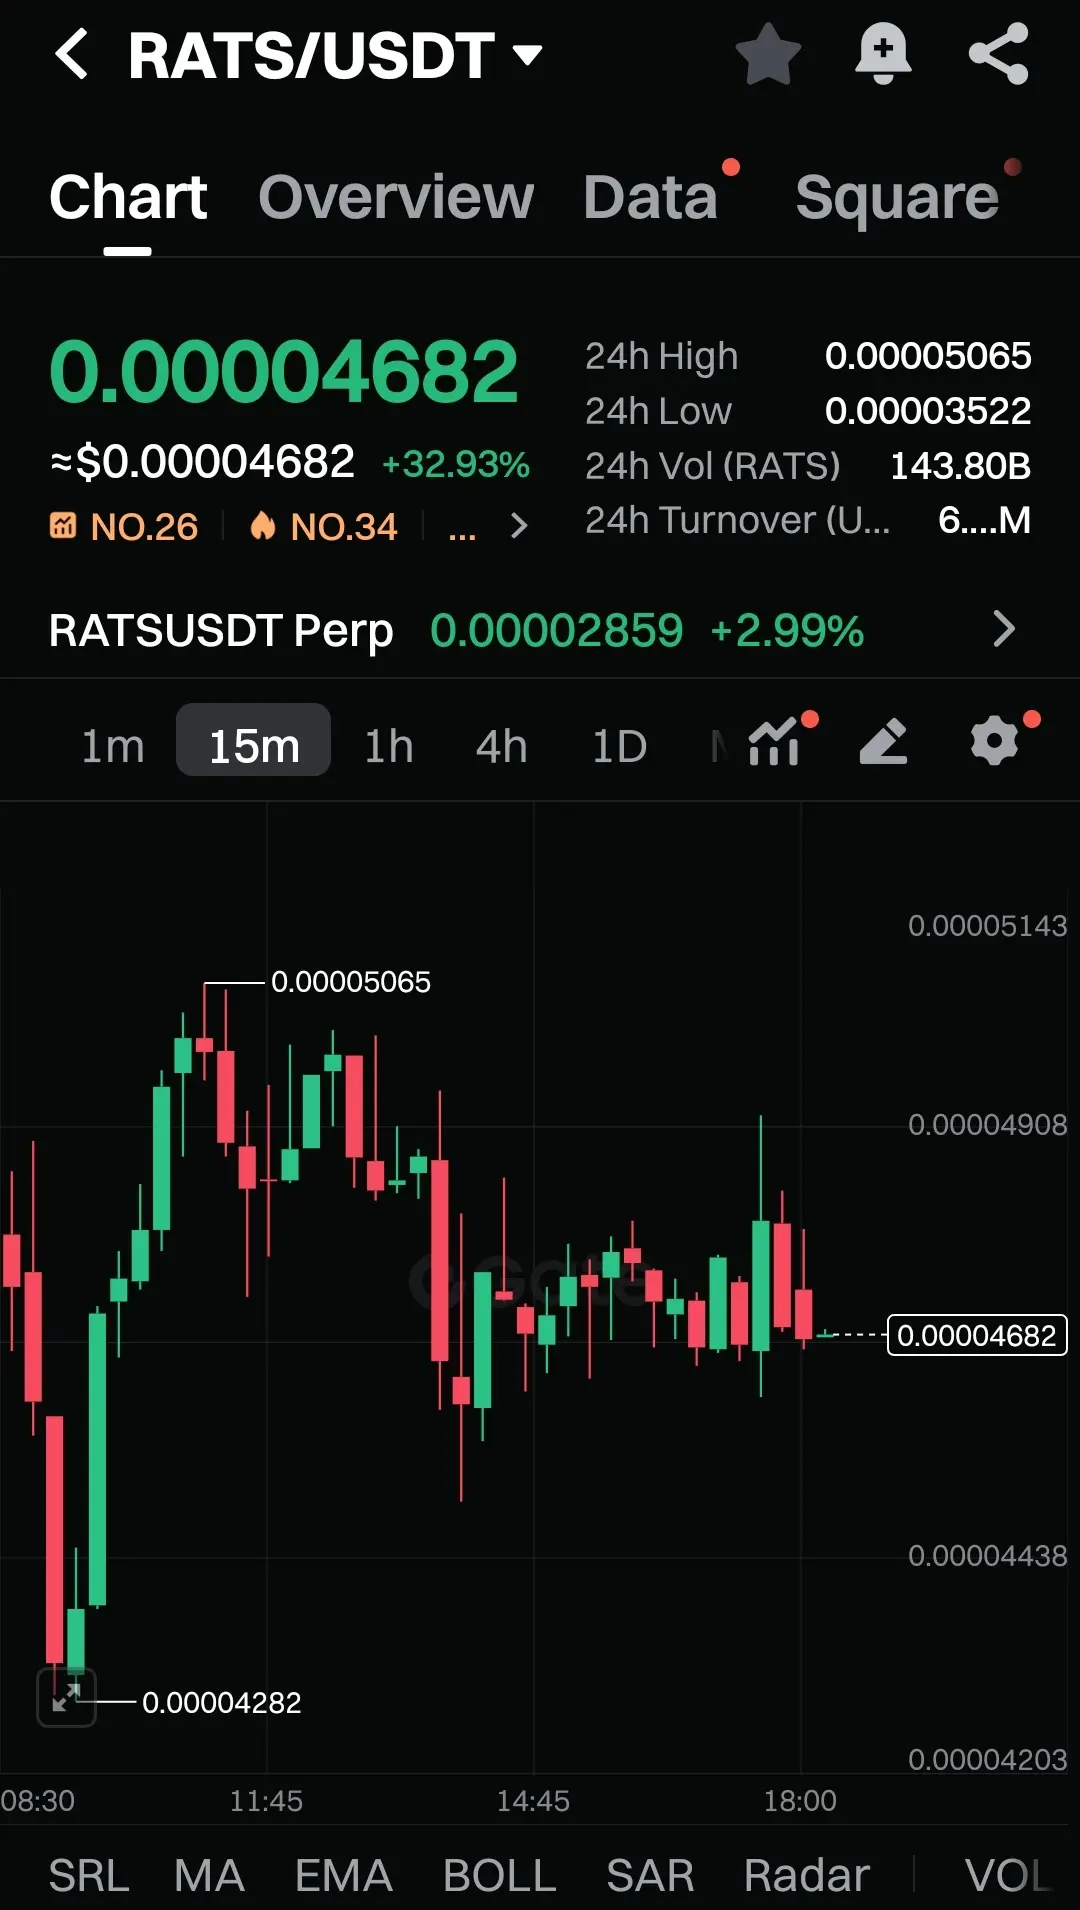
$RATS Just Exploded and the Chart Is Still Alive
RATS is firing at 0.00004682, up a massive 32%, and the momentum is still pulsing through the candles. The move from the 0.00003522 low straight into the 0.00005065 high shows how aggressive buyers were today.
After touching the peak, price cooled into the 0.00004600 – 0.00004900 range, where the chart is now tightening and building pressure again. This zone is the fight zone — hold here, and the next breakout attempt comes fast.
If RATS pushes above 0.00004908 with strength, we’re heading straight back toward 0.00005143, and that’s where th
RATS-14.97%
- Reward
- 1
- 1
- Repost
- Share
Falcon_Official :
:
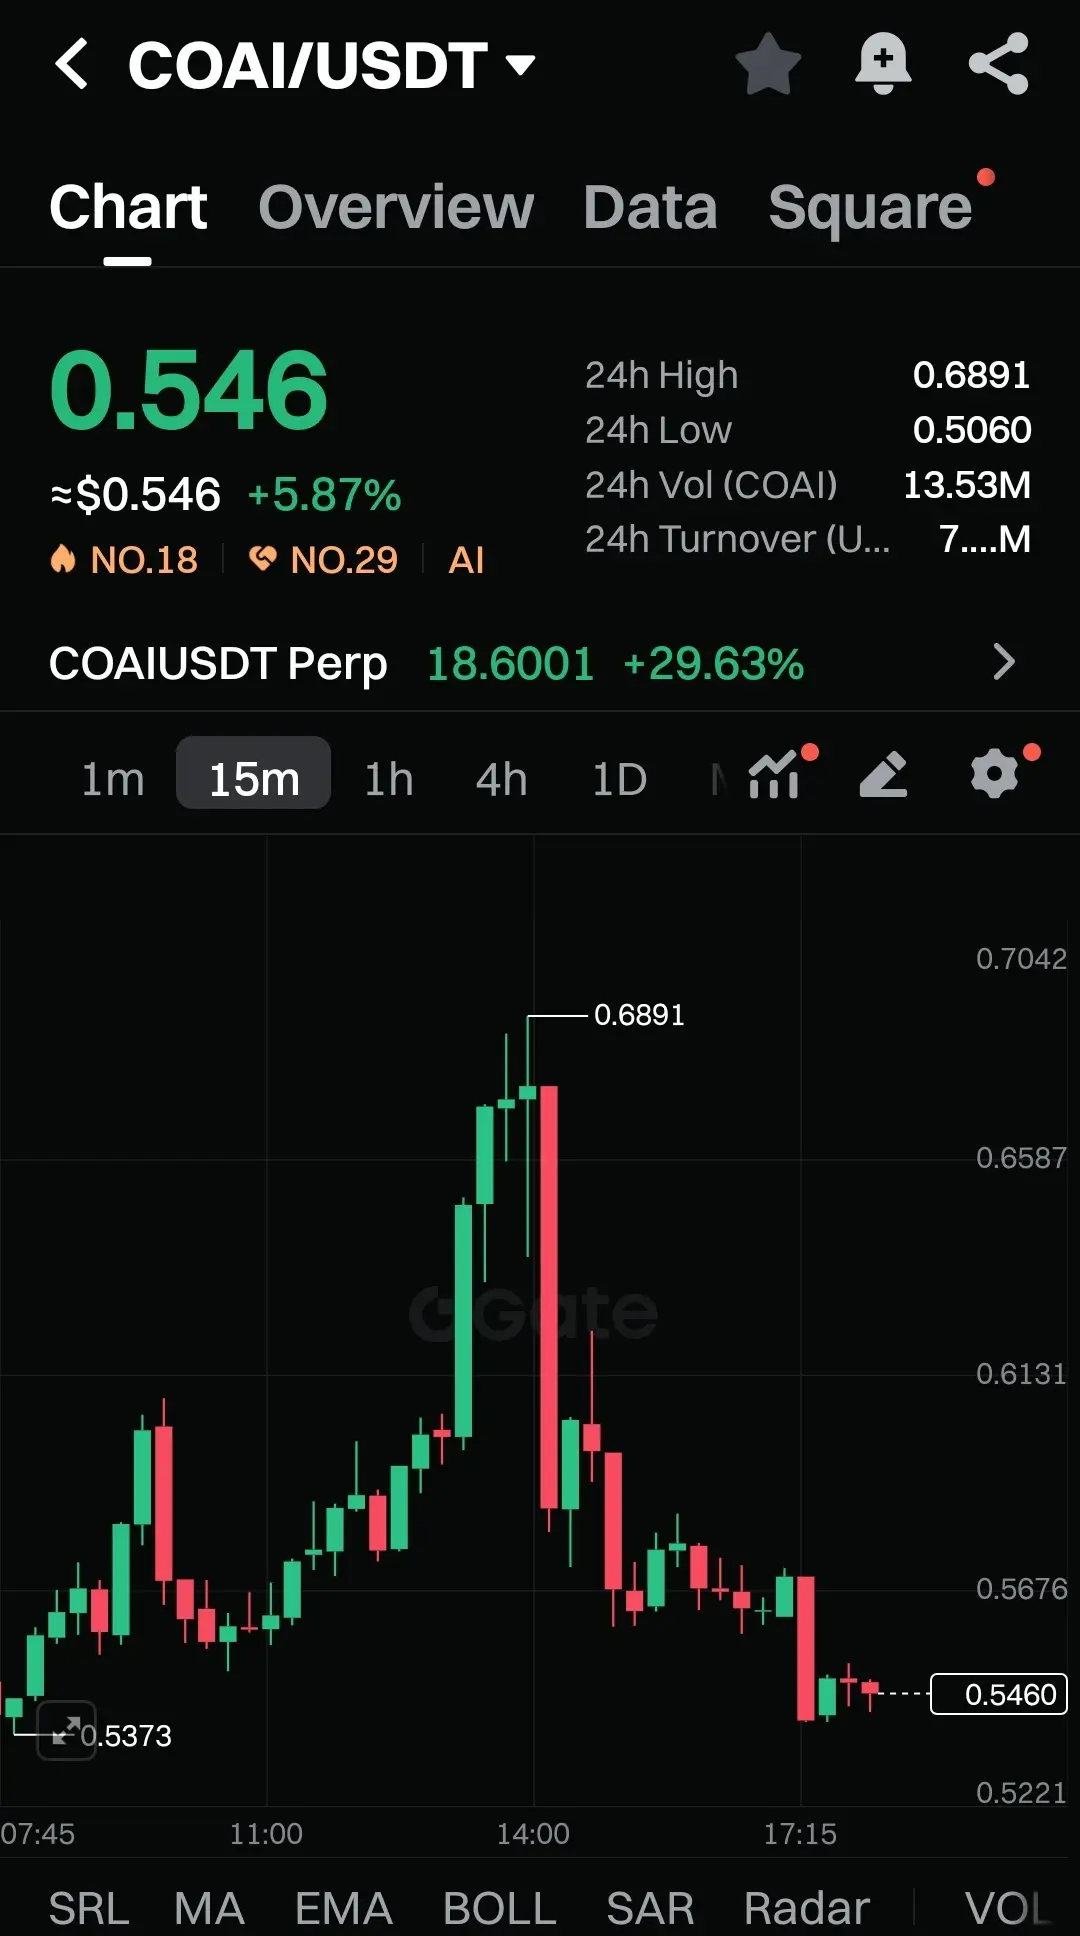
HODL Tight 💪$COAI Just Delivered a Wild Ride
COAI is sitting at 0.546 after a massive run that sent price all the way to 0.6891, and the chart still feels charged with energy. That huge spike showed real strength, but the pullback that followed is now testing the market’s patience.
Price dropped from the top and slipped into the 0.546 – 0.567 range, where candles are tightening and momentum is cooling down. This zone decides everything now.
If COAI reclaims 0.5676 with force, it can push back toward 0.613 and even reattempt the peak near 0.6891. The earlier breakout proves the liquidity is there.
But
COAI-11.49%
- Reward
- 1
- Comment
- Repost
- Share