Trade
Trading Type
Spot
Trade crypto freely
Alpha
Points
Get promising tokens in streamlined on-chain trading
Pre-Market
Trade new tokens before they are officially listed
Margin
Magnify your profit with leverage
Convert & Block Trading
0 Fees
Trade any size with no fees and no slippage
Leveraged Tokens
Get exposure to leveraged positions simply
Futures
Futures
Hundreds of contracts settled in USDT or BTC
Options
HOT
Trade European-style vanilla options
Unified Account
Maximize your capital efficiency
Demo Trading
Futures Kickoff
Get prepared for your futures trading
Futures Events
Participate in events to win generous rewards
Demo Trading
Use virtual funds to experience risk-free trading
Earn
Launch
CandyDrop
Collect candies to earn airdrops
Launchpool
Quick staking, earn potential new tokens
HODLer Airdrop
Hold GT and get massive airdrops for free
Launchpad
Be early to the next big token project
Alpha Points
NEW
Trade on-chain assets and enjoy airdrop rewards!
Futures Points
NEW
Earn futures points and claim airdrop rewards
Investment
Simple Earn
Earn interests with idle tokens
Auto-Invest
Auto-invest on a regular basis
Dual Investment
Buy low and sell high to take profits from price fluctuations
Soft Staking
Earn rewards with flexible staking
Crypto Loan
0 Fees
Pledge one crypto to borrow another
Lending Center
One-stop lending hub
VIP Wealth Hub
Customized wealth management empowers your assets growth
Private Wealth Management
Customized asset management to grow your digital assets
Quant Fund
Top asset management team helps you profit without hassle
Staking
Stake cryptos to earn in PoS products
BTC Staking
HOT
Stake BTC and earn 10% APR
GUSD Minting
Use USDT/USDC to mint GUSD for treasury-level yields

More
UnlimitedCryptoTrading
No content yet
UnlimitedCryptoTrading
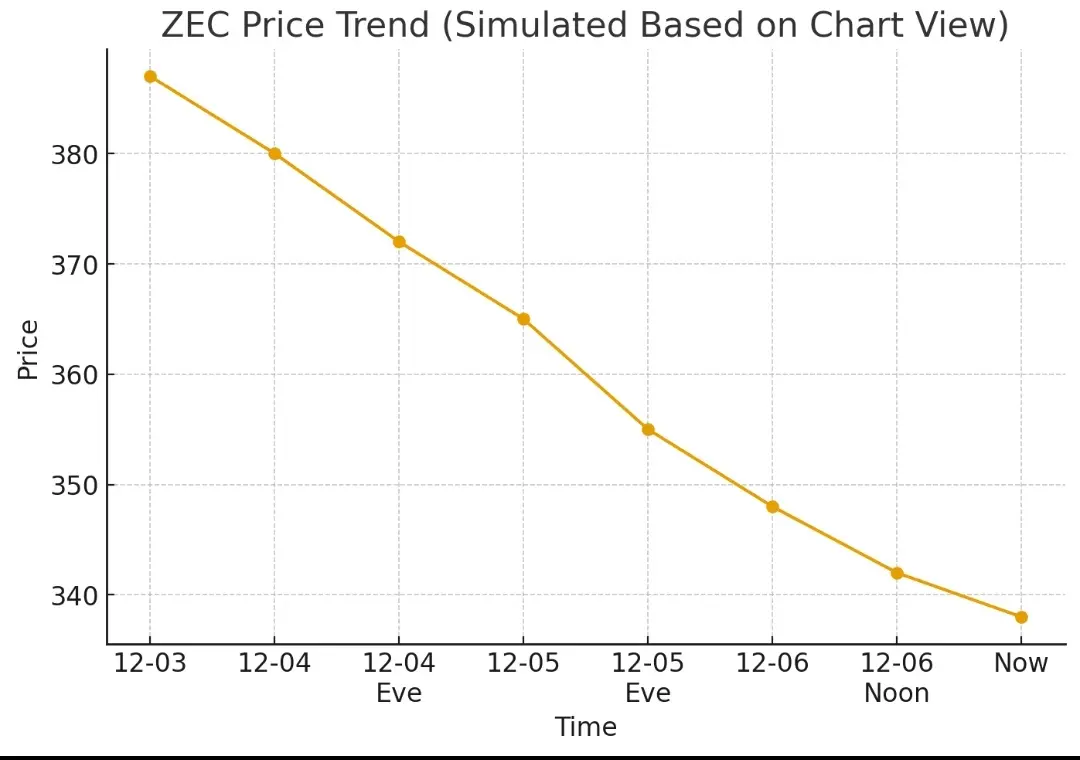
$ZEC 📉 ZEC Market Update (1H View)
ZEC has been sliding down steadily, moving from the mid-380 zone to around the 330s. Buyers are still quiet and indicators show a clear cooldown phase.
What the chart suggests:
MACD → still negative, momentum weak
RSI → sitting low, showing selling pressure but also potential for a bounce
Bollinger Bands → price hugging the lower band, meaning the market is oversold
Short-term (1H) → downtrend
Mid-term (4H) → weakening momentum
Long-term (1D) → still in correction mode
My personal view:
If ZEC can hold near the current support zone, it may try a small reco
ZEC-9.26%
- Reward
- like
- Comment
- Repost
- Share
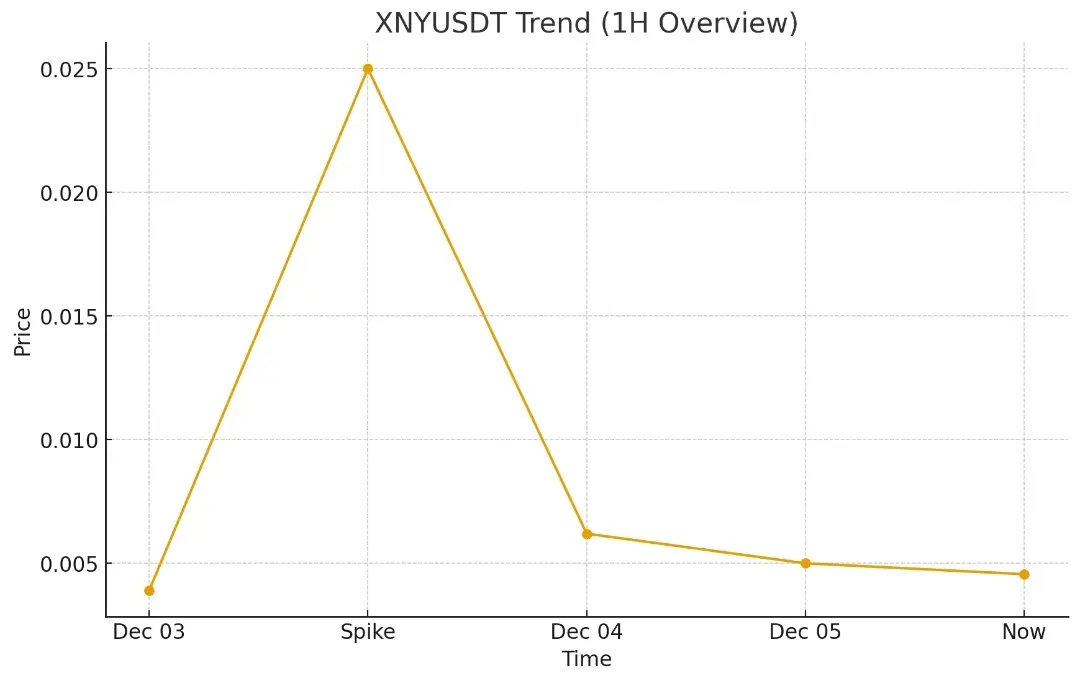
$XNY 📊 XNY Market Update (1H View)
XNY showed a huge spike earlier, but after that the price kept cooling down and is now moving in a tight range around 0.0045. Volume is lower and indicators are showing consolidation.
What I’m seeing:
MACD → still below the signal, momentum weak
RSI → sitting low, meaning sellers are slowing down
Bollinger Bands → price squeezing, breakout chance rising
Short-term (1H) → sideways
Mid-term (4H) → slowly stabilizing
Long-term (1D) → possible recovery if volume returns
My personal outlook:
If XNY holds above the support area and volume picks up, we may see a
XNY-17.07%
- Reward
- 1
- Comment
- Repost
- Share
$SUI SUI 1H Market Update
SUI has been sliding steadily these last couple of days, now sitting around 1.51 after touching the 1.5101 support area. The chart still shows a clear downtrend, but the pace of the drop is slowing down.
What I’m noticing:
• EMAs are tight and still pointing down
• MACD is flat — selling pressure losing strength
• RSI sitting near the lower zone, showing the market is tired
• KDJ also trying to turn up from oversold levels
Short-term view:
If the 1.50–1.51 support holds, a small bounce toward 1.54–1.56 can happen.
If price breaks below 1.50, then the downtrend may e
SUI-0.99%

- Reward
- like
- Comment
- Repost
- Share
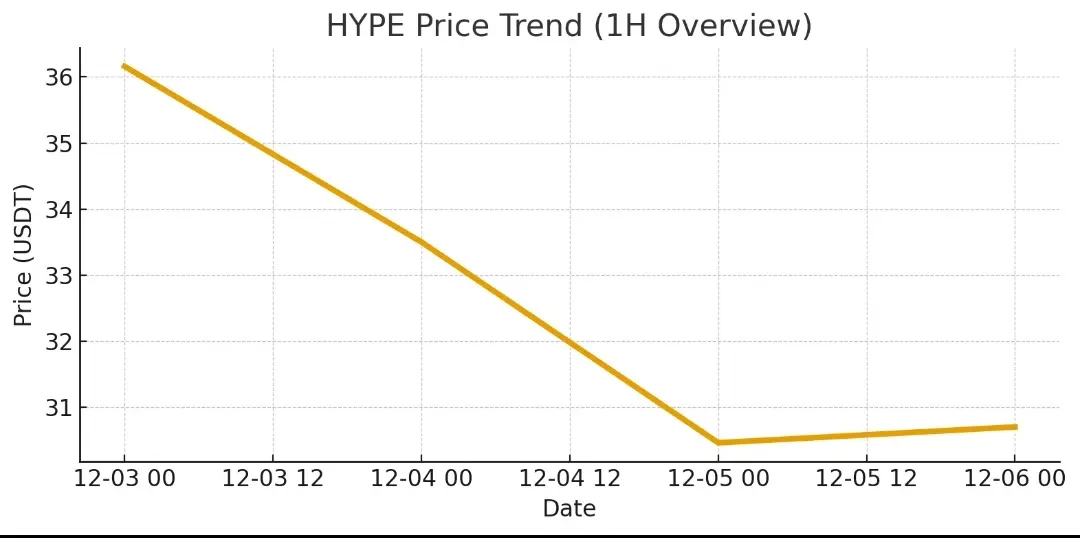
$HYPE HYPE Market Update (1H Chart View)
Price is sitting around $30.70 after a steady pullback from the recent $32+ zone.
Short-term momentum indicators (EMA/MACD/RSI) still show a slow recovery attempt, but sellers remain active near the $31 area.
What I’m watching next:
If price holds above the $30.40 – $30.60 support range, a small bounce toward $31.20 – $31.50 is possible.
Breaking below $30.40 may push the trend into another dip.
On the 4H timeframe, market is still in a cooling phase but losing downside strength — early signs of a potential base forming.
My outlook:
Market is still in
HYPE0.72%
- Reward
- like
- Comment
- Repost
- Share
$XRP XRP 1H Market Update
XRP has been in a steady downtrend these last sessions, dropping from the 2.21 area to around 2.03. The price finally showed a small bounce after touching the 2.0105 support, which is a good sign that sellers might be cooling off.
What I’m seeing right now:
• Clear downtrend but losing momentum
• EMAs are still above the candles — trend not flipped yet
• RSI and KDJ both trying to move upward
• MACD weakness is slowing down
Short-Term Outlook:
If buyers hold above 2.02–2.03, we might see a move toward 2.06–2.08.
If the market rejects again, the next support sits n
XRP0.09%

- Reward
- 1
- 1
- Repost
- Share
GateUser-78c1f623:
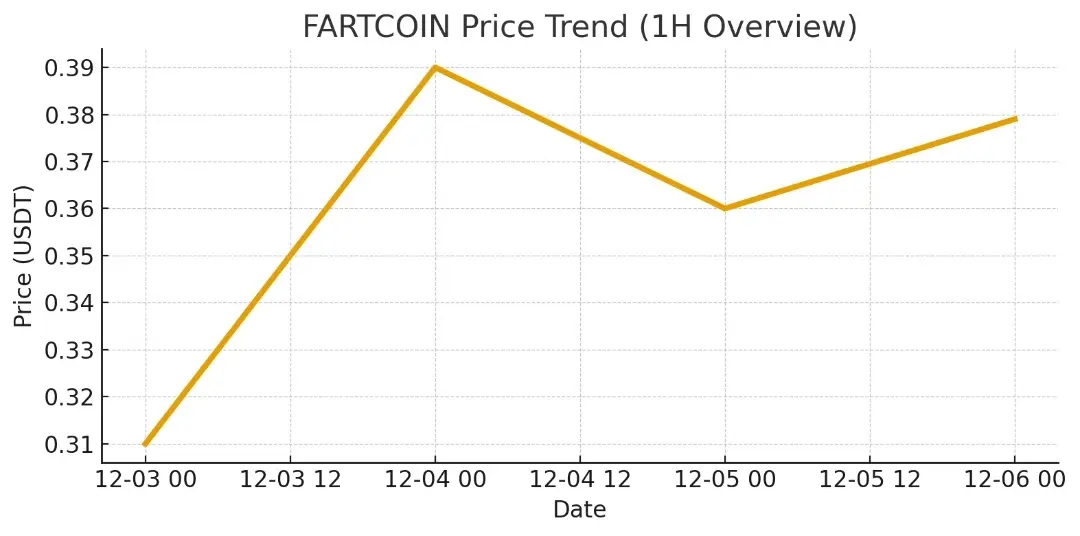
Ape In 🚀$FARTCOIN FARTCOIN Market Update (1H Chart View)
Price is holding around 0.379 with steady higher lows forming. Multiple EMAs are clustering, showing a tightening range — usually a sign that a bigger move is coming.
What I’m seeing:
• Bulls defending the 0.36–0.37 zone
• Momentum indicators slowly turning upward
• Chart forming a small squeeze, expecting volatility next
Possible Outlook:
If it breaks upward, I’m watching 0.40 – 0.415 first.
If it breaks down, support sits near 0.355 – 0.36.
Different Timeframe Thoughts:
Short-term (1H): Sideways but slightly bullish
Mid-term (4H): Recovery s
FARTCOIN10.72%
- Reward
- like
- 2
- Repost
- Share
GateUser-7d65e2ab:
hiView More
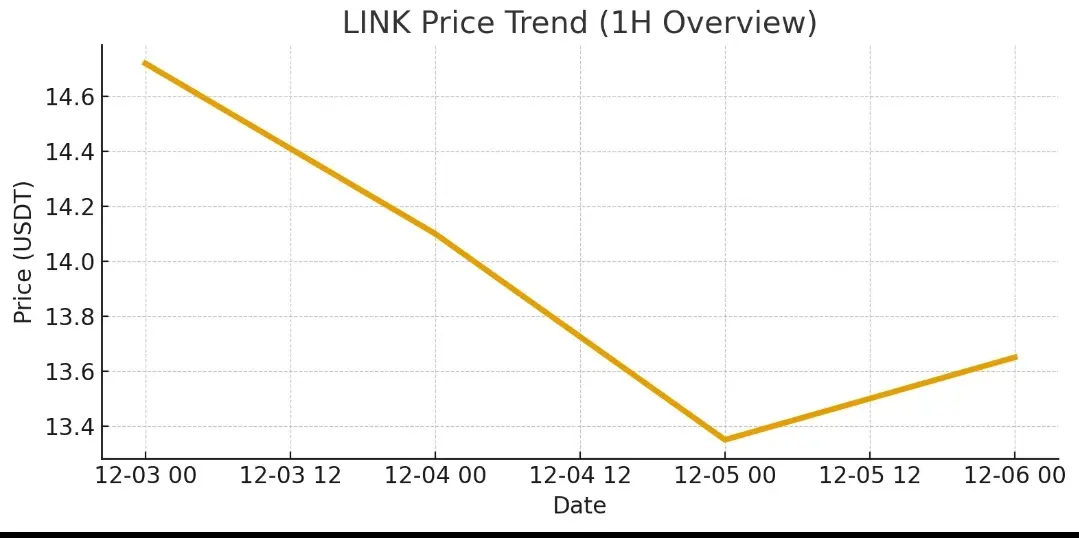
LINK Market Update – 1H View
LINK has been sliding down from the 14.7 area and touched 13.35 before showing a small recovery. Price is still moving under the short-term moving averages, so the trend is soft but stabilizing.
What the indicators show:
• MACD is slowly improving but still weak
• RSI hovering in the mid-zone → neutral mood
• KDJ showing a mild bullish cross
• Bollinger Bands tightening → possible breakout soon
My short-term view (just my own opinion):
If LINK holds above 13.50, it could push toward 13.90–14.10.
If it loses this area, it may retest around 13.30.
This is only my per
LINK3.41%
- Reward
- like
- Comment
- Repost
- Share
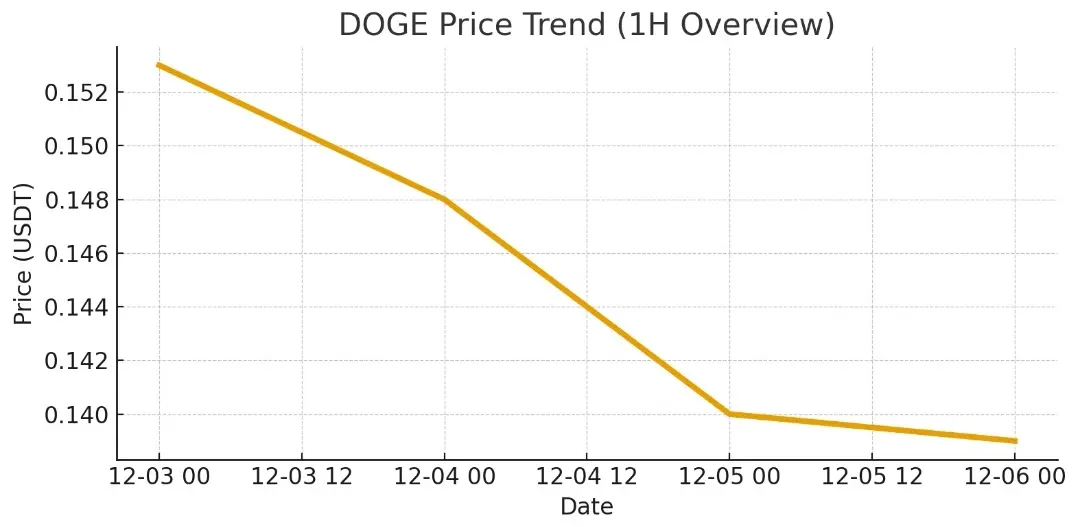
$DOGE DOGE Market Update – 1H View
DOGE has been trending down from the 0.15 zone and is now trying to hold around 0.139. Price is still under most short-term moving averages, so sellers remain a bit stronger.
What I’m seeing:
• Momentum is slowly improving, but still weak
• MACD is trying to turn upward
• RSI hovering near mid-range → neutral mood
• KDJ showing a small recovery signal
My short outlook (just my own opinion):
If DOGE stays above 0.138, a small bounce toward 0.142–0.145 is possible.
If it breaks below 0.138, it may retest the 0.135 area.
This is only my personal view — not fin
DOGE1.38%
- Reward
- like
- Comment
- Repost
- Share
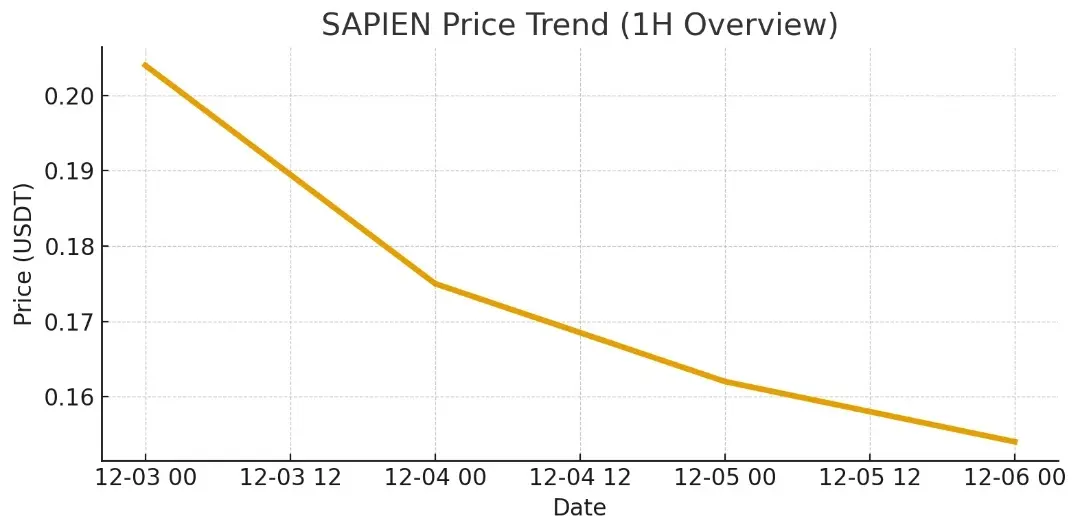
$SAPIEN SAPIEN Market Update – 1H View
SAPIEN has been sliding down from the 0.20 zone and is now holding around 0.154. Price is staying under most short-term MAs, showing sellers still in control.
What I’m seeing now:
• Trend still leaning bearish
• MACD flat → weak momentum
• RSI sitting below 40 → market cooling
• Bollinger Bands tightening → possible move soon
My short-term outlook (personal view only):
If the price manages to stay above 0.150, we might see a small bounce toward 0.160–0.165.
If it loses this level, the next support area could be around 0.140.
This is just my opinion — no
SAPIEN-5.16%
- Reward
- like
- Comment
- Repost
- Share
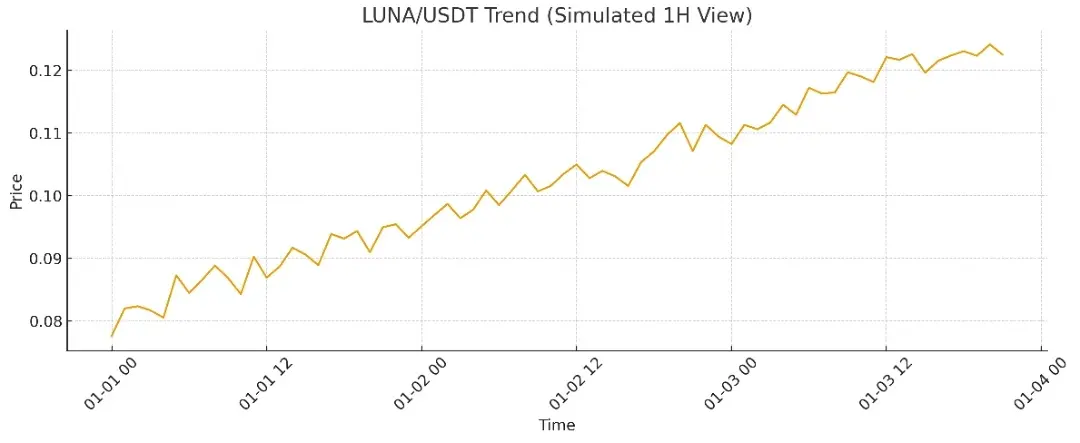
$LUNA Market Update – LUNA (1H Analysis)
LUNA just showed a clean breakout from the recent range, pushing up toward the 0.12 zone before a small pullback. Price is still holding above key MAs and riding the trend steadily.
What I’m watching next:
• Higher timeframes still look bullish
• MACD remains above signal → momentum alive
• RSI cooling off → room for another push
• If price stays above 0.110 support, next leg toward 0.125–0.135 looks possible
• If it drops below support, retest around 0.100 may happen
Short-term view:
Trend is still positive. Pullbacks are getting bought up quickly.
T
LUNA31.57%
- Reward
- like
- Comment
- Repost
- Share
$BOB 📉 BOB/USDT Market Update (1H View)
BOB is moving in a slow downward channel, staying under most short-term moving averages. After the recent drop toward the lower range, the price is trying to stabilize but momentum is still soft.
1H Signals:
• Trend still slightly bearish
• MACD close to flipping but not confirmed
• RSI sitting in the mid-40s → neutral to weak
• Small bounce attempts, but no strong breakout yet
Future Outlook (Personal Opinion Only):
If the price can hold this support zone, a gradual recovery toward the mid-range is possible. If momentum fades again, the market may co
BOB-1.85%

- Reward
- 1
- Comment
- Repost
- Share
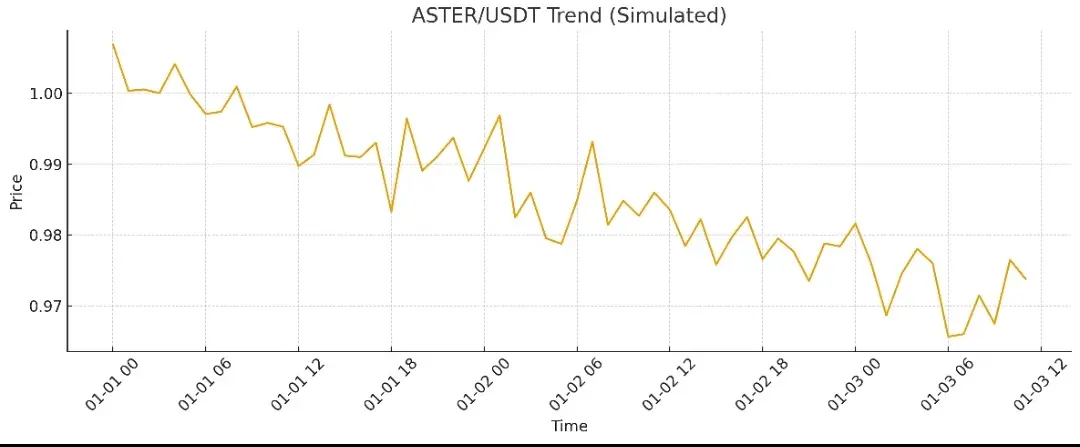
📉 ASTER/USDT Market Update (1H Chart)
ASTER has been slowly trending down, staying below all major moving averages. Momentum indicators like RSI and KDJ are still showing weakness, which means the market is cooling off.
Short-term view (1H):
• Price is holding around the lower Bollinger band
• MACD still below the signal line → bearish pressure
• A small bounce is possible if buyers react near support
Medium-term view (4H):
• Trend is still soft
• Waiting for a clean reversal signal before calling a strong recovery
Future outlook (Opinion Only):
If the price can hold current support and volum
ASTER-3.04%
- Reward
- like
- 2
- Repost
- Share
SalemMabkhout:
Bullish market at its peak 🐂View More
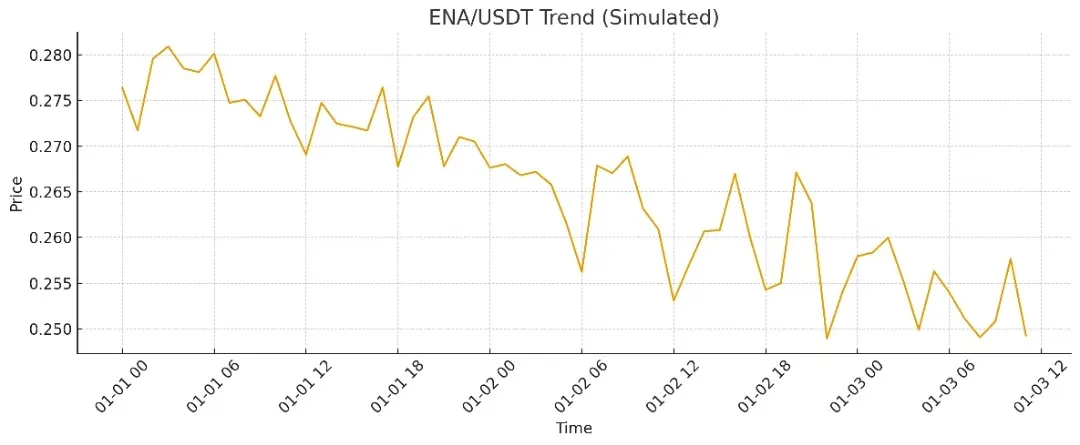
ENA/USDT Market Update (1H Analysis)
ENA has been under pressure for the last sessions, dropping near 0.257 after touching the 0.2548 low. Sellers dominated most of the move, but the chart is now slowing down around the lower Bollinger Band.
Key signals I’m watching:
EMA 5/10/20 still pointing down, but the angle is getting softer, meaning the downtrend is losing strength.
MACD is flat, showing momentum is cooling and could turn for a small bounce.
RSI sitting around 33–37, which is close to oversold territory — usually where reactions happen.
Bollinger Bands tightening, often a sign of upcomi
ENA2.02%
- Reward
- 1
- Comment
- Repost
- Share
$RLS RLS/USDT Update:
RLS bounced strongly from the 0.018 zone and is slowly building momentum again. On the 1H chart, candles are now holding above the short MAs, which shows buyers are trying to take control. Bollinger Bands are tightening, so a directional move may come soon. RSI is climbing but still not overbought — healthy momentum.
My view:
– Staying above 0.021 keeps the uptrend recovery active.
– If volume picks up and price breaks above 0.023, next push can continue.
– Falling back under 0.020 may slow the move again.
Just sharing my personal opinion — trade safe.
RLS17.35%

- Reward
- 1
- Comment
- Repost
- Share
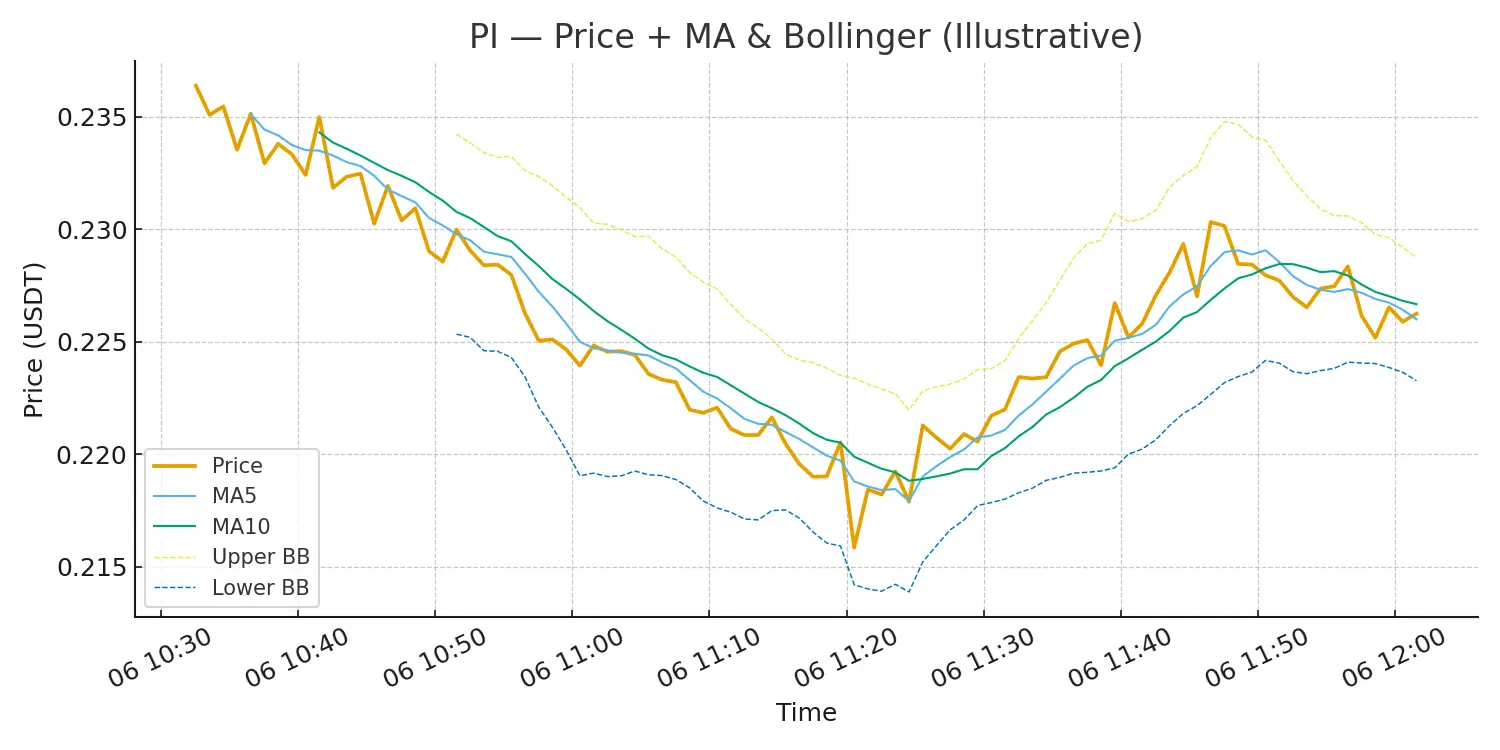
$PI PI/USDT Quick View:
Price bounced nicely from the 0.218 zone after a long down move. On the 1H chart, candles are trying to stay above short MAs, but the trend is still weak. Bollinger Bands are tightening, showing a possible breakout setup. RSI is mid-zone, so momentum can build in either direction.
My outlook:
– Holding above 0.223 keeps the recovery active.
– A clean push above 0.230 may open room for another leg up.
– If it slips under 0.220 again, correction might extend.
Just my personal opinion — trade safe.
PI1.01%
- Reward
- 1
- 2
- Repost
- Share
EmperorGuangying :
:
冲就完了💪View More
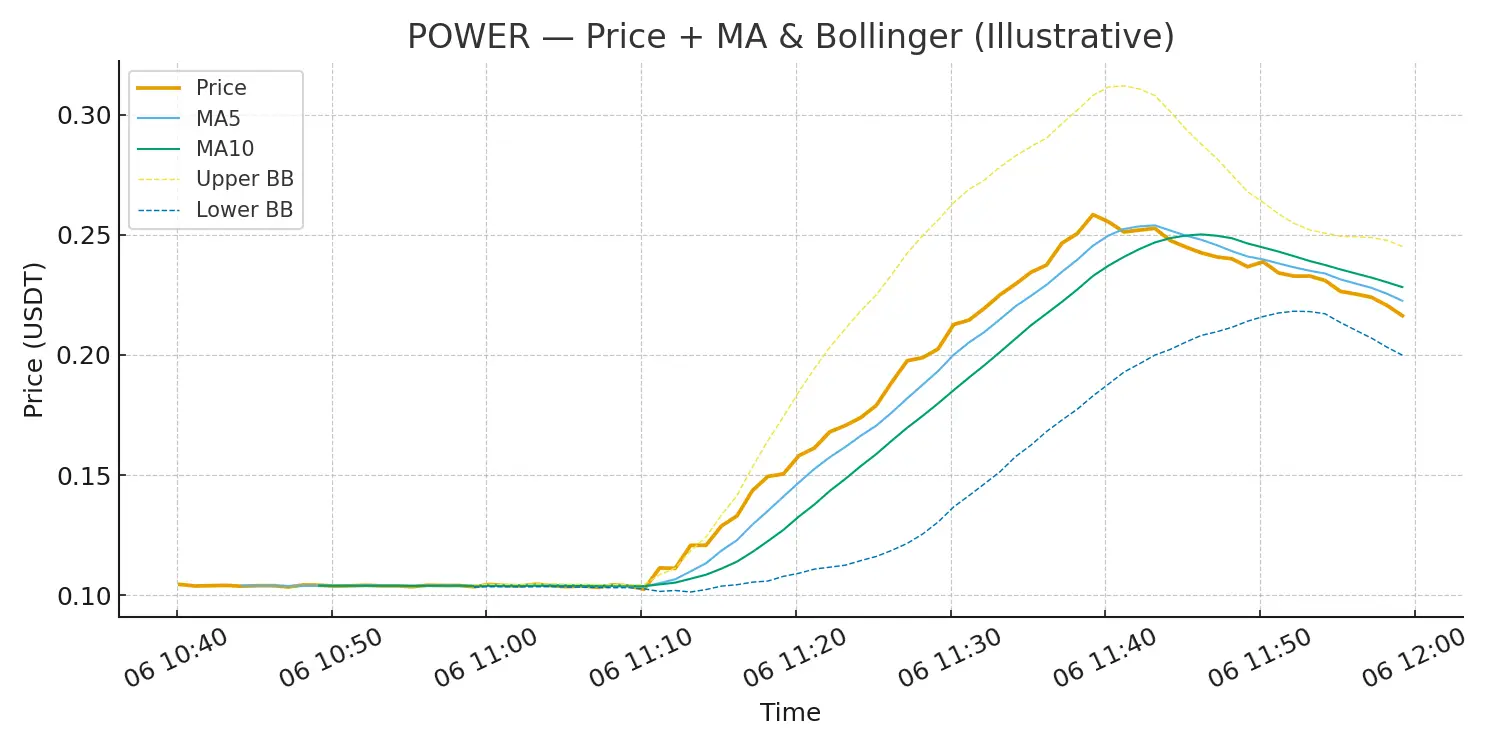
$POWER POWER quick update:
Price made a massive breakout after a long flat range, pushed up to around the 0.25 zone, and now pulling back naturally. MA5 is still above MA10, showing the trend is cooling off but not broken yet. If it holds above the short-term support around 0.21–0.22, momentum can rebuild again.
Short-term outlook:
Holding above MA10 keeps the uptrend alive.
Break above recent top may open room toward higher levels.
If candles close below MA10 for long, expect deeper correction.
This is just my personal view — trade safe.
- Reward
- like
- Comment
- Repost
- Share
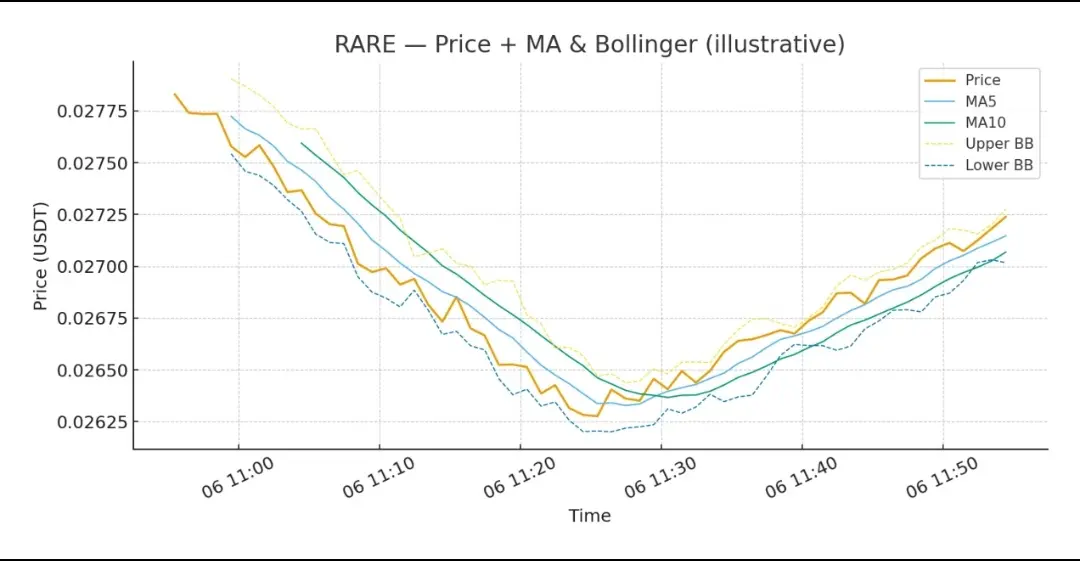
RARE quick view — small recovery after dip
1. Price right now: ~0.0272. Recent dip hit ~0.0263 and we’re slowly reclaiming ground.
2. Short-term (minutes–hours): price hugging MA5/MA10 — if MA5 stays above MA10 and price closes above the upper Bollinger, expect a push toward 0.028–0.029.
3. Mid-term (days): momentum (RSI) not overheated — neutral to mildly bullish. If support holds at ~0.0265, target range 0.030–0.034 on a clean trend continuation.
4. Risk note: failure below 0.0263/0.0260 could re-open deeper sell zones. Trade size and stops matter.
Methods used: moving averages (MA5, MA10),
RARE12.12%
- Reward
- 2
- Comment
- Repost
- Share
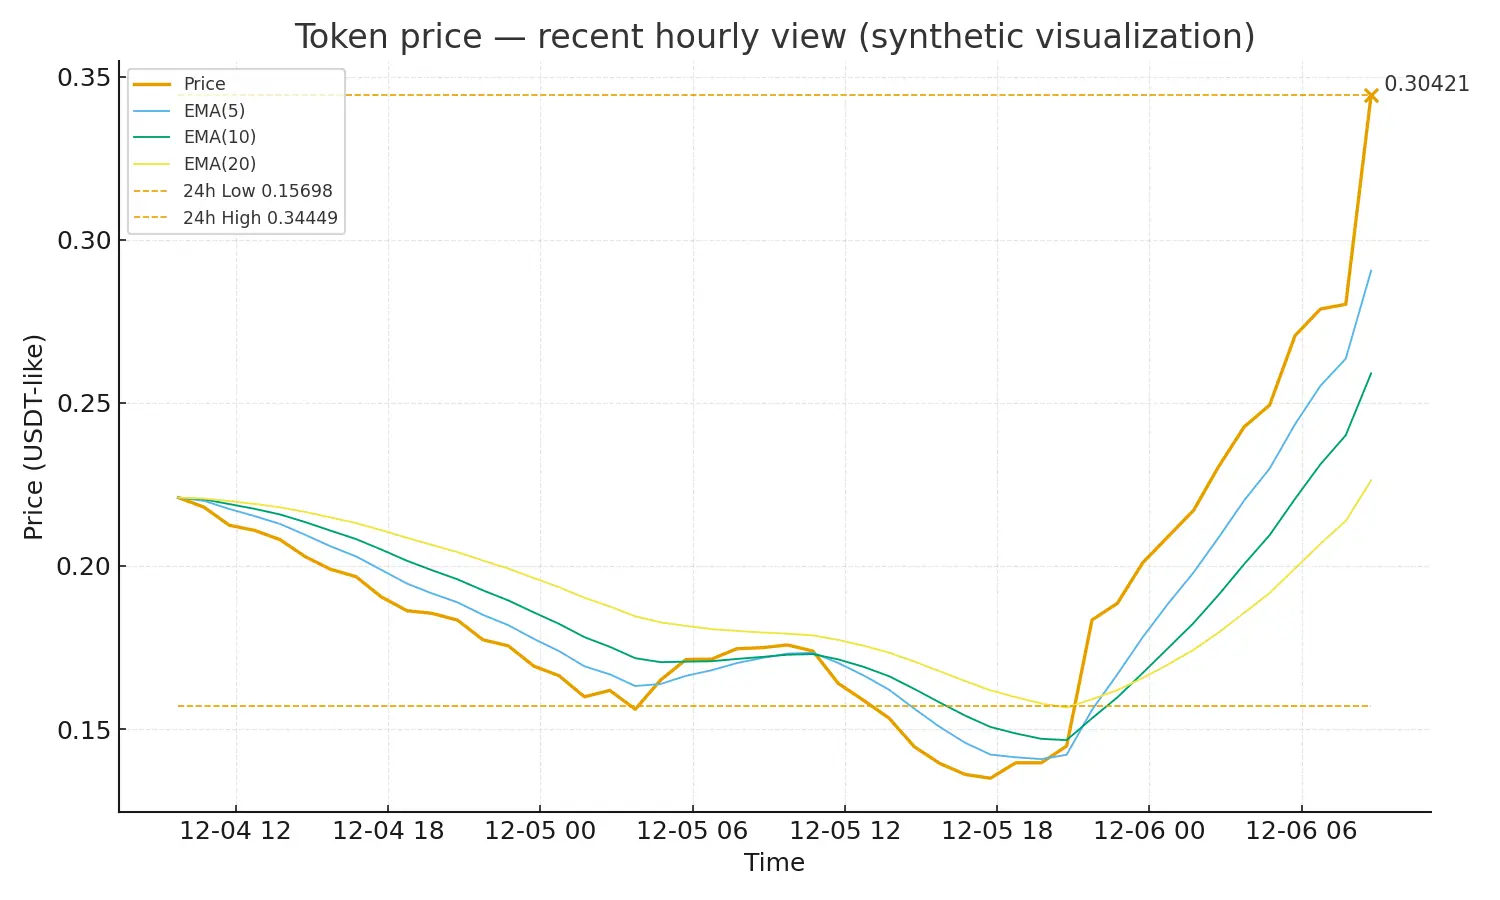
$PIPPIN Big move here — price jumped hard from the consolidation zone and just printed a strong spike. Short-term momentum is very hot (RSI/EMAs show heavy buying) so expect two likely scenarios:
• Short-term (next few hours): continuation is possible but RSI is overbought — a quick pullback to 0.22–0.26 is the most likely cooling-off.
• Mid-term (1–7 days): price could either hold above the breakout area (bull case) and target ~0.45, or retest the prior base near 0.12–0.18 if volume fades.
• Key levels to watch: Support ~0.22, Resistance ~0.35, 24h low 0.15698, 24h high 0.34449.
My read: re
PIPPIN40.72%
- Reward
- like
- Comment
- Repost
- Share
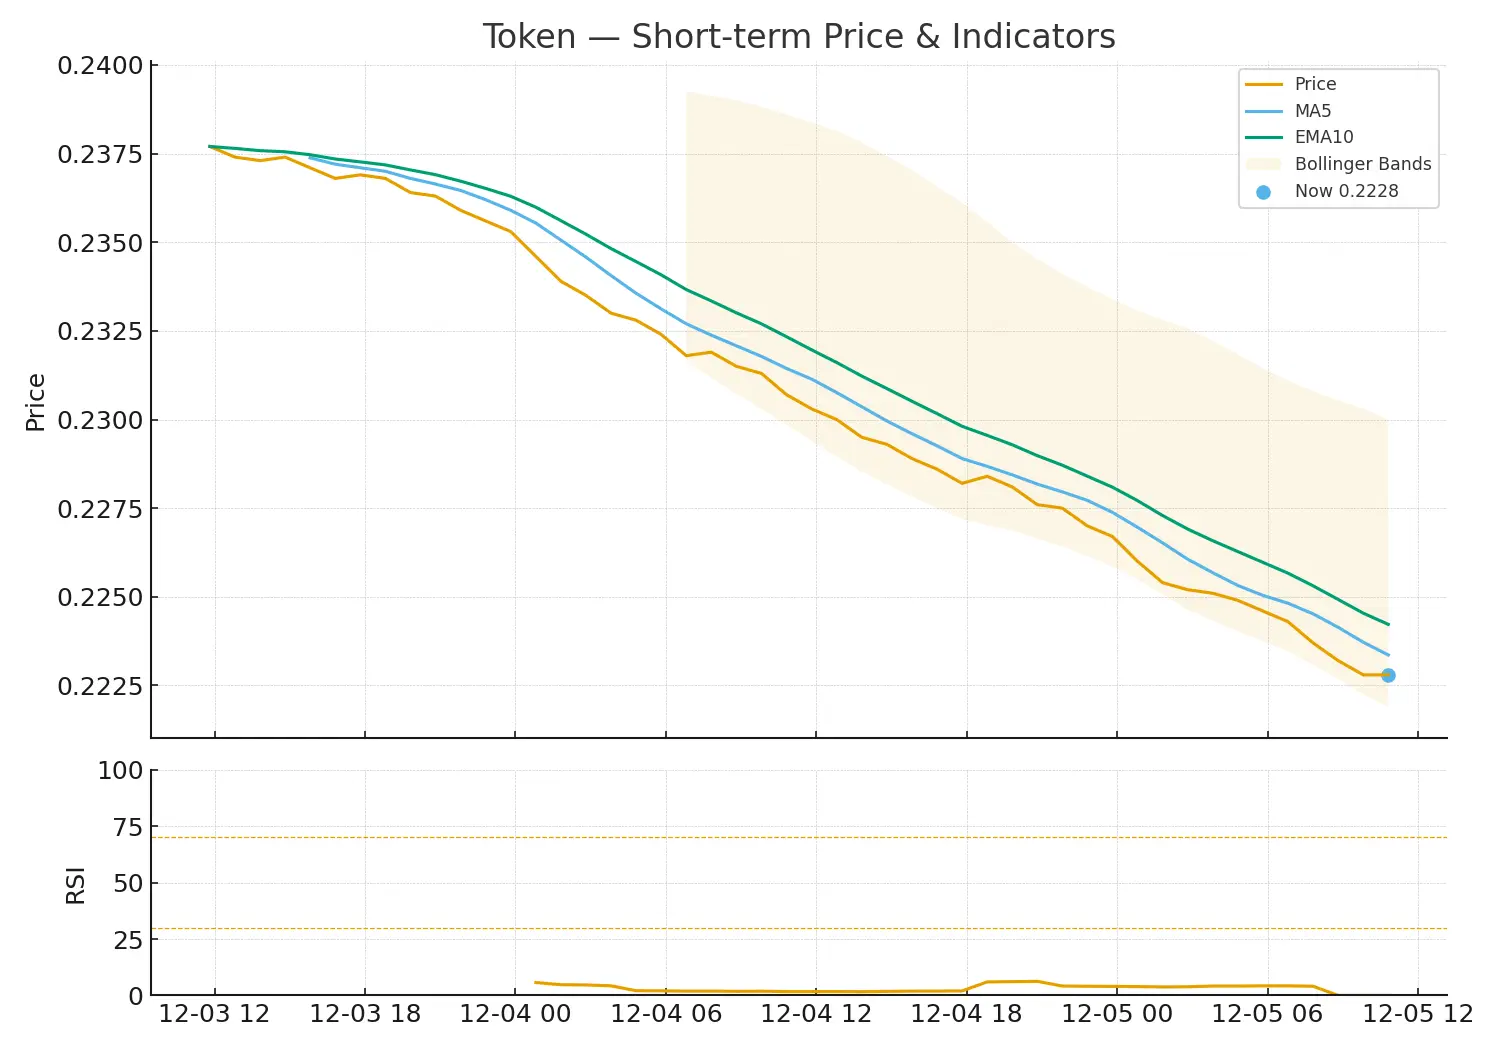
$PI Quick note on this token — price slid from the recent highs and dipped to the ~0.225 area. Short-term momentum is weak (RSI low, MACD recently bearish) so expect either a small relief bounce or a slow grind lower.
Predictions (opinions, not financial advice):
• Short (1–6h): small bounce toward the 0.228–0.231 band if buyers step in.
• Medium (6–48h): likely consolidation between 0.223–0.233; watch volume and RSI for a real breakout.
• Long (multi-day): if price breaks and holds below 0.22, deeper correction possible; a clear reclaim of 0.237+ would signal recovery.
Keep position sizes s
PI1.01%
- Reward
- 6
- 1
- Repost
- Share
ASYAKAYA:
Ape In 🚀$BTC BTC Update (1H View):
BTC is holding steady around the 93k zone after pulling back slightly from the 94.1k area. Price candles are still sitting above the short EMAs, showing buyers are trying to maintain control. Bollinger Bands are tightening a bit, meaning the market is preparing for the next move.
On indicators, RSI is mid-range — neither overheated nor weak — which often means BTC has room to move if volume picks up. MACD is flat but still above the line, showing the trend hasn’t flipped yet.
Short-term view:
Holding above 92.5k–92.8k keeps the bullish structure alive. If BTC stays
BTC0.41%

- Reward
- 2
- Comment
- Repost
- Share