Futures
Access hundreds of perpetual contracts
TradFi
Gold
One platform for global traditional assets
Options
Hot
Trade European-style vanilla options
Unified Account
Maximize your capital efficiency
Demo Trading
Introduction to Futures Trading
Learn the basics of futures trading
Futures Events
Join events to earn rewards
Demo Trading
Use virtual funds to practice risk-free trading
Launch
CandyDrop
Collect candies to earn airdrops
Launchpool
Quick staking, earn potential new tokens
HODLer Airdrop
Hold GT and get massive airdrops for free
Pre-IPOs
Unlock full access to global stock IPOs
Alpha Points
Trade on-chain assets and earn airdrops
Futures Points
Earn futures points and claim airdrop rewards
More
ETH Key Position Game: Is 2200 Truly the Starting Point or a Watershed?⚠️
Current Price: 2199
—
From the overall structure, ETH has now entered the “Battle Zone”, not a one-sided trend, but a typical consolidation with volatility + direction choice phase. The details are explained in different cycles below👇
—
📊 Daily level: The trend is not bad, but it has entered a key resistance zone
The daily structure is very clear: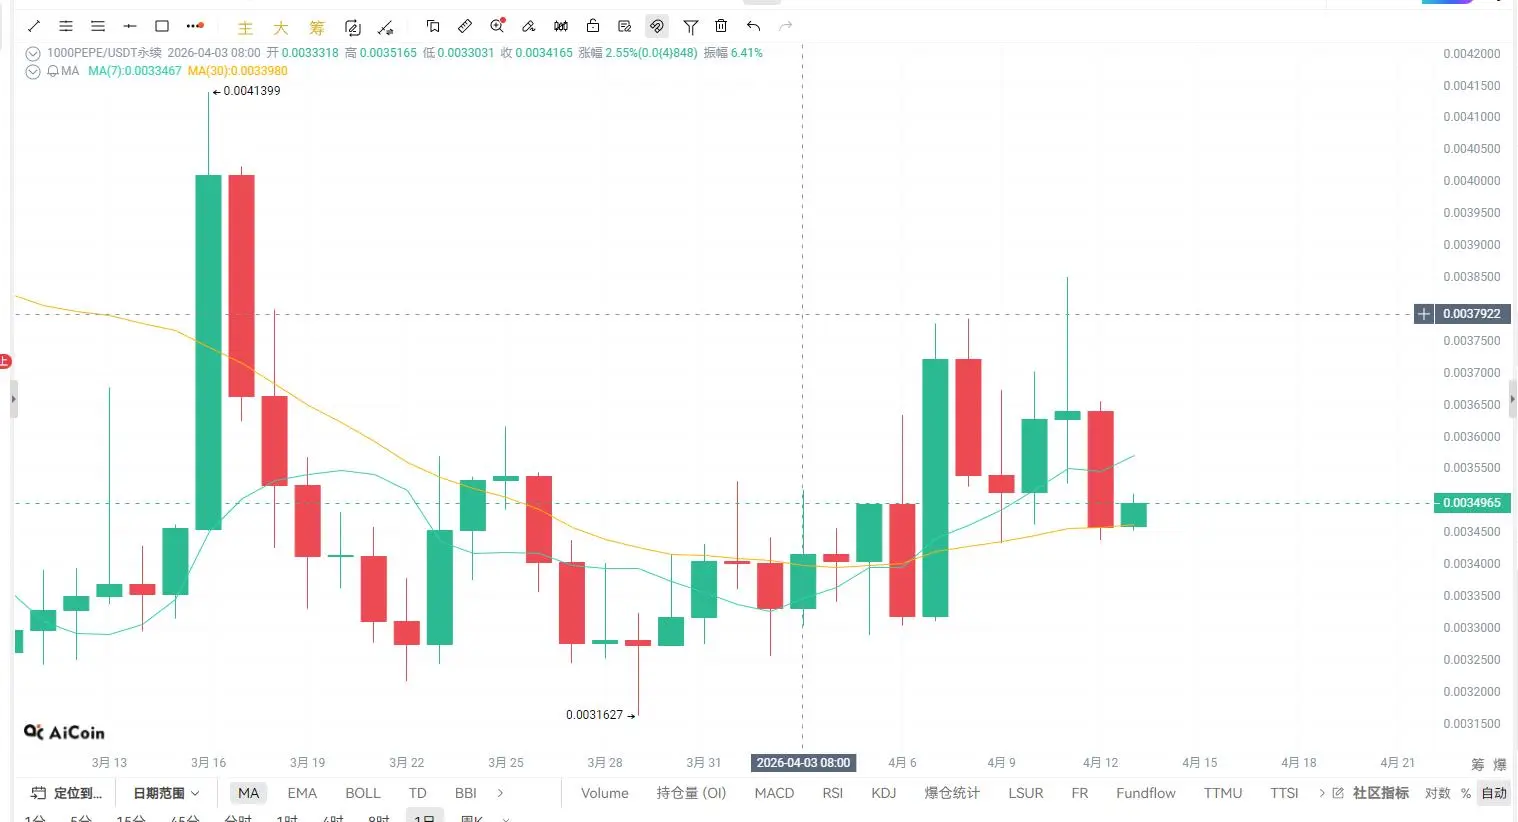
But the issues are:
👉 Conclusion: The daily chart is leaning bullish, but this is not a buy-the-rip zone, rather a zone of divergence
—
📊 Four-hour level: Rallies fade, short-term enters correction phase
The 4-hour chart provides more critical information: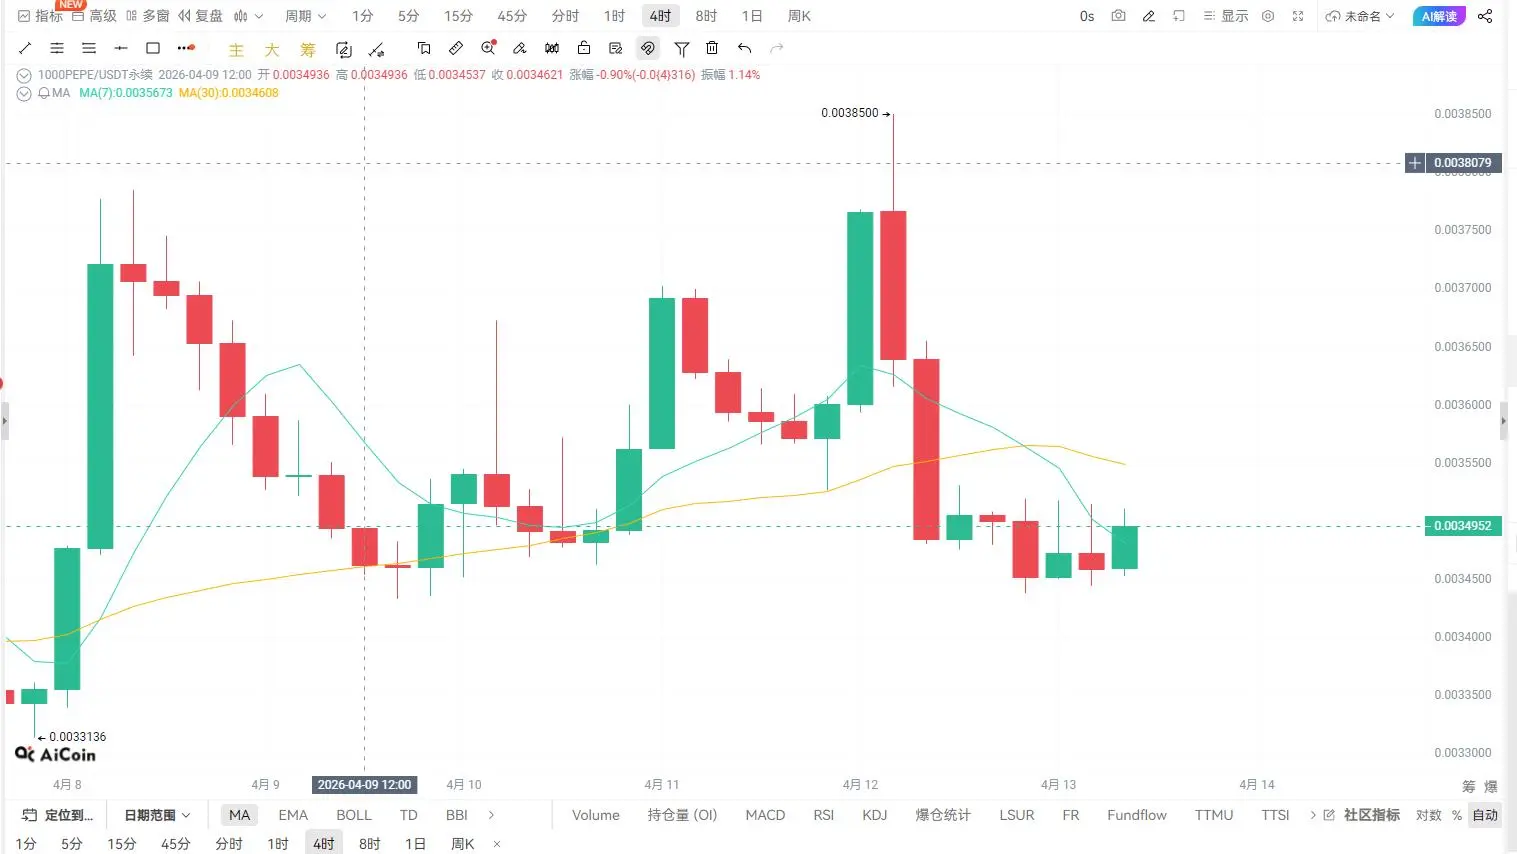
Focus on two key levels:
👉 Conclusion: The 4-hour has shifted from strength to oscillation with a slight bearish bias, and a new direction needs to be chosen
—
📊 One-hour level: Oscillation converges, waiting for a breakout
The 1-hour chart is typical: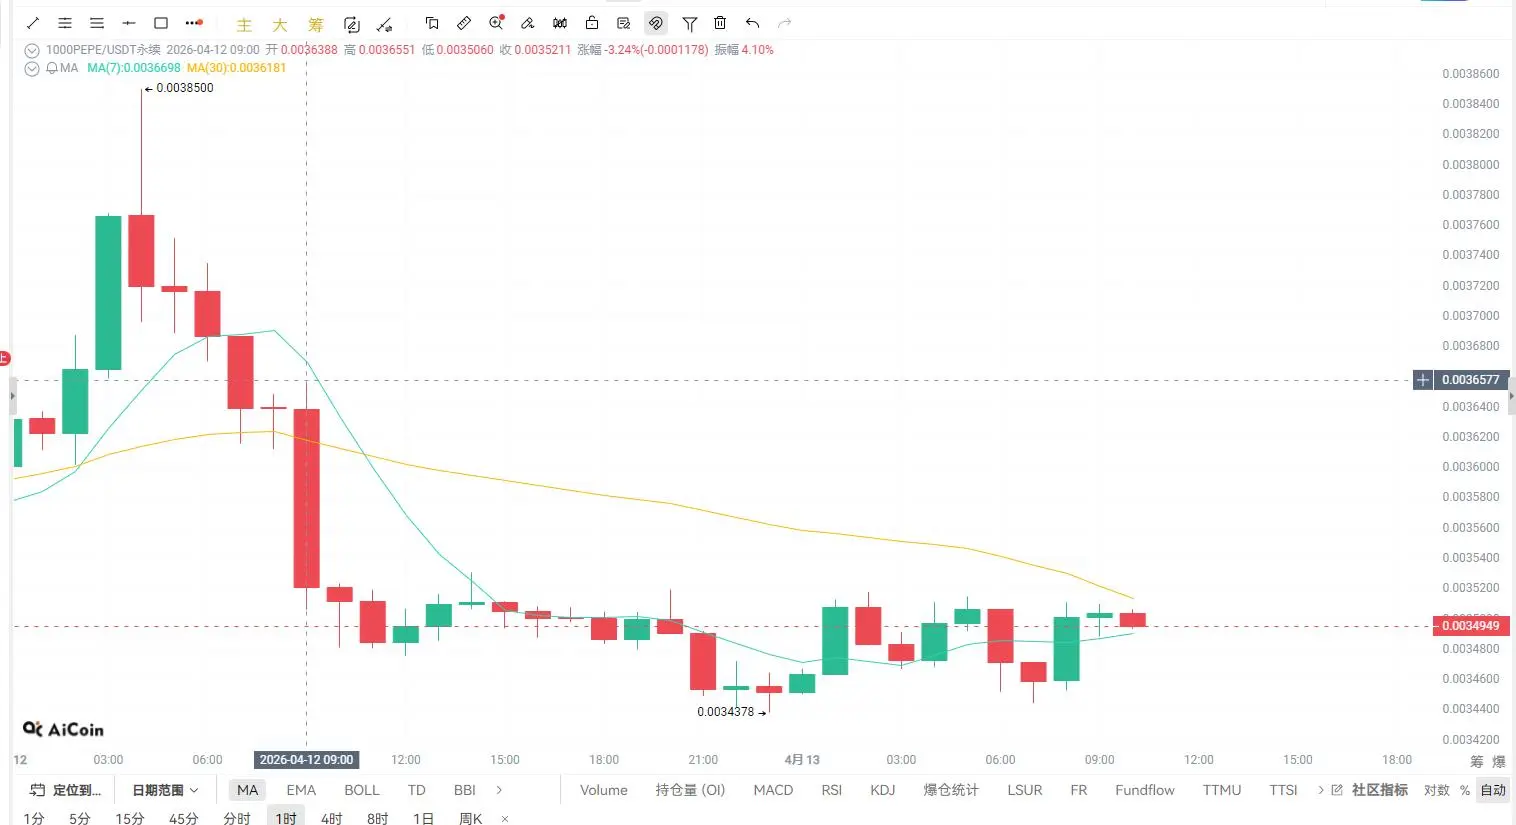
What does this indicate? 👉 The market is waiting for a trigger point (news or big funds action)
Key short-term levels:
—
🎯 Trading strategy (key points):
Now is not the time to “be bullish or bearish,” but to wait for confirmation of the trend before acting
✅ Bullish approach:
❌ Risk points:
✅ Bearish approach:
—
🧠 Big player perspective:
The current market essentially is: 👉 Heavy trapped positions above, more bottom-fishing positions below
Big players prefer this structure— Washing back and forth, repeatedly shaking out the impatient.
Real trend movements don’t start when everyone understands them.
—
⚠️ Final key point:
This is not a “lack of opportunities,” but a stage that requires extremely precise rhythm.