Trade
Trading Type
Spot
Trade crypto freely
Alpha
Points
Get promising tokens in streamlined on-chain trading
Pre-Market
Trade new tokens before they are officially listed
Margin
Magnify your profit with leverage
Convert & Block Trading
0 Fees
Trade any size with no fees and no slippage
Leveraged Tokens
Get exposure to leveraged positions simply
Futures
Futures
Hundreds of contracts settled in USDT or BTC
Options
HOT
Trade European-style vanilla options
Unified Account
Maximize your capital efficiency
Demo Trading
Futures Kickoff
Get prepared for your futures trading
Futures Events
Participate in events to win generous rewards
Demo Trading
Use virtual funds to experience risk-free trading
Earn
Launch
CandyDrop
Collect candies to earn airdrops
Launchpool
Quick staking, earn potential new tokens
HODLer Airdrop
Hold GT and get massive airdrops for free
Launchpad
Be early to the next big token project
Alpha Points
NEW
Trade on-chain assets and enjoy airdrop rewards!
Futures Points
NEW
Earn futures points and claim airdrop rewards
Investment
Simple Earn
Earn interests with idle tokens
Auto-Invest
Auto-invest on a regular basis
Dual Investment
Buy low and sell high to take profits from price fluctuations
Soft Staking
Earn rewards with flexible staking
Crypto Loan
0 Fees
Pledge one crypto to borrow another
Lending Center
One-Stop Lending Hub
VIP Wealth Hub
Customized wealth management empowers your assets growth
Private Wealth Management
Customized asset management to grow your digital assets
Quant Fund
Top asset management team helps you profit without hassle
Staking
Stake cryptos to earn in PoS products
BTC Staking
HOT
Stake BTC and earn 10% APR
GUSD Minting
Use USDT/USDC to mint GUSD for treasury-level yields
More


- Trending TopicsView More
241.72K Popularity
34K Popularity
744 Popularity
5.65K Popularity
5.01K Popularity
- Hot Gate FunView More
- MC:$3.62KHolders:10.00%
- MC:$3.81KHolders:40.62%
- MC:$3.62KHolders:10.00%
- MC:$3.63KHolders:10.00%
- MC:$3.69KHolders:10.54%
- Pin
Analyst sets date when Bitcoin will trade at $160,000
Although Bitcoin (BTC) has corrected after hitting an all-time high above $125,000, an analyst has noted that technical indicators suggest there is still room for the asset to reach $160,000 in the coming months.
As of press time, Bitcoin was trading at $124,874, up about 1.2% in the last 24 hours, and has rallied over 10% in the past week.
TradingShotIn a TradingView post on October 6, the expert indicated that this level turned into strong support, reinforcing the ongoing bull cycle pattern.
TradingView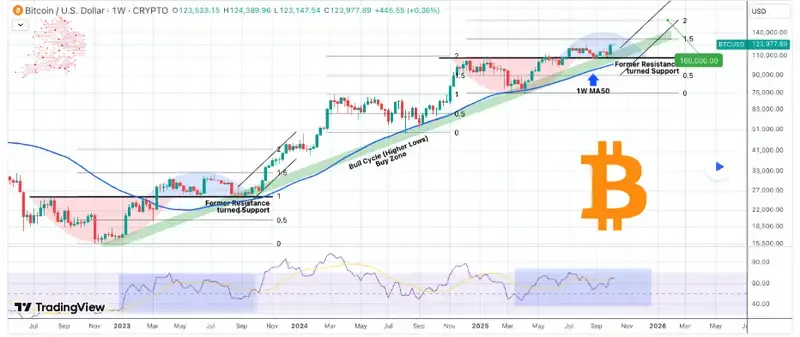 Bitcoin price analysis chart. Source: TradingView**Bitcoin price analysis chart. Source: TradingViewThe outlook noted that Bitcoin is forming a series of higher lows within a clear ascending trend line, supported by the 50-week moving average (MA)
This setup indicates continued upward momentum, mirroring the bullish phase observed in August 2023 that led to significant price gains.
The Analysis also highlighted Fibonacci extension levels as key markers for future price targets. Currently, the rally appears to be tracking the 2.0 Fibonacci extension, which has historically aligned with previous market peaks
AnalysisBased on this pattern, Bitcoin’s trajectory points toward the $160,000 level within the first quarter of 2026, around January.
Bitcoin’s potential $200,000 target
Meanwhile, another outlook by pseudonymous cryptocurrency analyst Mikybull suggested that, in comparison to gold’s rally, Bitcoin has the potential to surge to $200,000.
MikybullIn an X post on October 6, the analyst suggested that Bitcoin’s ongoing market cycle is drawing parallels with gold’s historic rally in the 1970s.
Therefore, the comparison implies that Bitcoin, much like gold then, could be entering the speculative phase of its cycle, supported by Livermore’s speculative metric, which projects a potential top above $200,000.
From a macroeconomic standpoint, the trend reflects growing inflation risks rather than robust economic growth, suggesting that investors may increasingly view Bitcoin as a hedge, similar to gold’s role in the past.
Featured image via Shutterstock
Featured image via ShutterstockFeatured image via Shutterstock