Bitcoin (BTC) is fluctuating around the $70,000 mark as of Saturday, down nearly 3% since the beginning of the week, ending a two-week recovery streak. The weakening trend appears as market sentiment is affected by the “hawkish” stance of the U.S. Federal Reserve (Fed) in its March monetary policy decision, exerting significant pressure on the leading cryptocurrency’s price. Meanwhile, contrasting capital flows into and out of spot ETFs reflect increasing caution among institutional investors, suggesting Bitcoin is likely to continue trading within a narrow range in the short term.
Hawkish Fed Pressures Risk Assets
Bitcoin started the week on a positive note, reaching $76,000 on Tuesday — the highest since early February — before reversing course, ending the week with a nearly 3% decline as of Saturday.
This decline mainly stems from the Fed’s hawkish stance during its March meeting on Wednesday, when it decided to keep interest rates steady in the 3.50%–3.75% range. Additionally, the Fed raised its year-end PCE inflation forecast to 2.7% (from 2.4% in December), citing increased risks from energy prices amid escalating tensions with Iran. The Fed also revised upward its growth outlook for 2026, but only expects one rate cut this year and another in 2027.
This firm message has dampened risk appetite in the markets, putting pressure on high-volatility assets like Bitcoin.
According to Aurelie Barthere, an analyst at Nansen, the Fed did not change its interest rate path but adjusted upward its inflation and growth forecasts for 2026. Notably, the focus of the press conference shifted more toward inflation than the labor market, reinforcing the hawkish tone of the policy statement.
She also noted that the upcoming Fed chair will inherit a cautious committee, ready to loosen policy only if unemployment rises sharply. On the market, selling pressure on BTC began around Tuesday noon (CET), amid escalating Iran–Israel tensions and attacks on gas infrastructure in Qatar. After the FOMC press conference, selling intensified, yet Bitcoin held its key support level around $70,000.
Institutional Flows Show Hesitation
Data from SoSoValue indicates that Bitcoin ETF spot capital flows were mixed this week: two strong inflows of $201.62 million on Monday and $199.37 million on Tuesday, followed by outflows of $163.52 million on Wednesday and $90.19 million on Thursday. This pattern reflects cautious sentiment and inconsistent behavior among institutional investors amid ongoing market uncertainties.
On the corporate side, Michael Saylor announced that MicroStrategy continued its accumulation, purchasing an additional 22,337 BTC, following last week’s purchase of 17,994 BTC. This brings their total holdings to 761,068 BTC, reinforcing their long-term accumulation strategy. Notably, the average purchase price was $75,696, higher than the current market level.
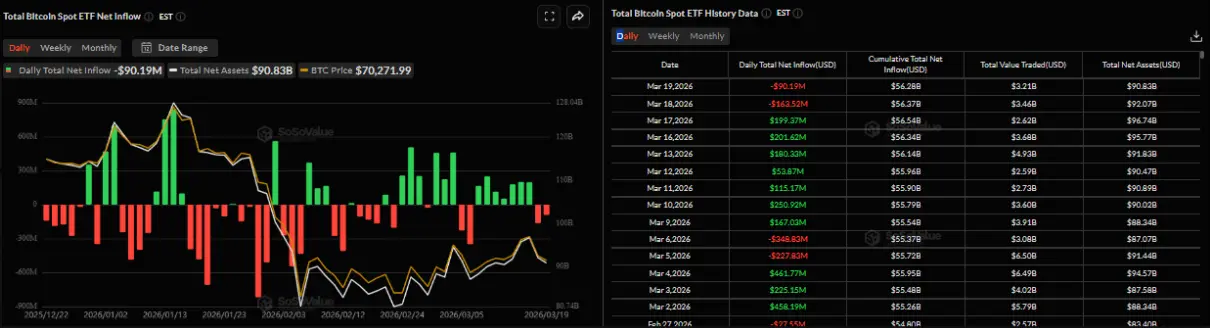 Daily net capital flow chart into Bitcoin Spot ETF | Source: SoSoValue## BTC Still Outperforms Other Assets Since Conflict Erupted
Despite a slight correction this week, Bitcoin has demonstrated resilience compared to traditional assets since the Middle East conflict escalated on February 28. The cryptocurrency has gained over 6% from the $65,800 level, while stocks and gold have experienced negative returns.
According to K33 Research, Bitcoin’s performance is particularly notable. In a “risk-off” environment — which typically exerts downward pressure on BTC — this time’s behavior defies the norm. Previously, Bitcoin’s sharp 50% decline was seen as a market risk absorption mechanism.
Analysts suggest Bitcoin is currently in a low-holding state, with high short-selling ratios and oversold conditions, which helps reduce the risk of further declines. As weak positions are cleared, selling pressure from investors diminishes, reinforcing Bitcoin’s role as a scarce asset with improving momentum.
Morgan Stanley Moves Closer to Bitcoin ETF
Morgan Stanley has filed its second amended S-1 registration statement with the SEC for a Bitcoin ETF, confirming that the Morgan Stanley Bitcoin Trust plans to list on NYSE Arca under the ticker MSBT.
According to the filing, each fund basket will consist of 10,000 shares, with an initial seed basket of 50,000 shares, estimated to raise around $1 million.
This move marks a significant step in the ETF approval process initiated in January. However, SEC approval is not guaranteed. If approved, Morgan Stanley could become the first major U.S. bank to directly launch a spot Bitcoin ETF.
Technical Analysis: BTC Maintains Key Support
On the weekly chart, BTC was rejected at the 74,508 USD level (2025 low) and experienced a slight correction but remains above the 200-week EMA around 68,098 USD.
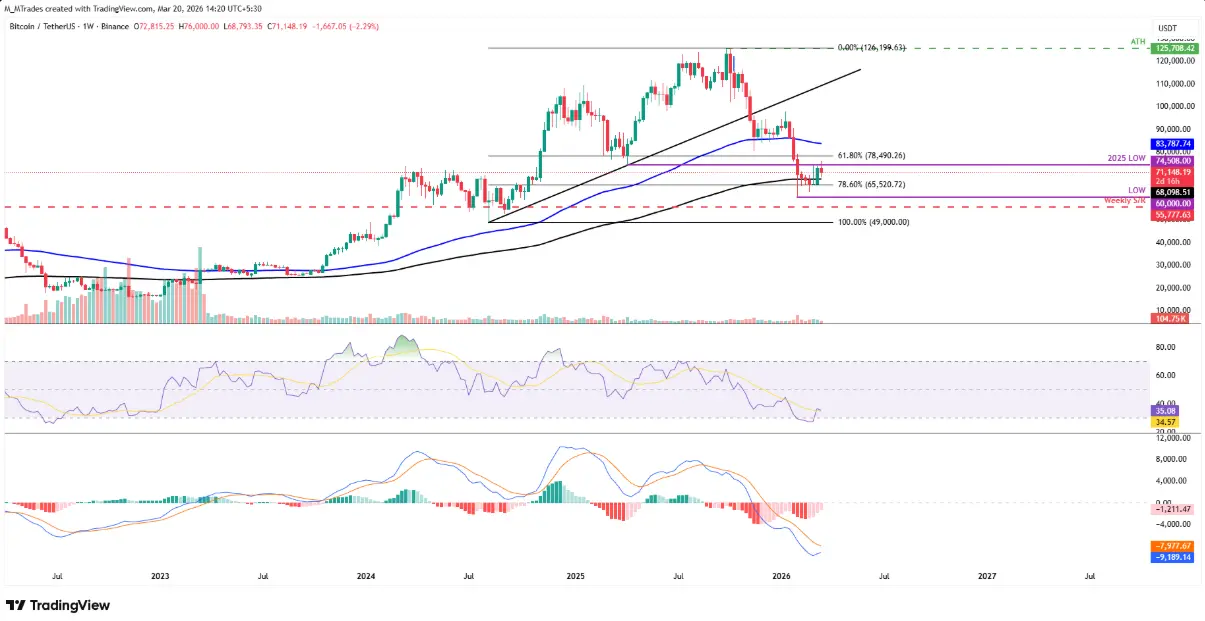 Weekly BTC/USDT Chart | Source: TradingView If the 200-week EMA (60,098 USD) continues to serve as strong support, BTC could extend its recovery toward the psychological resistance zone of $75,000. A weekly close above this level could strengthen the bullish trend, opening room toward the Fibonacci 61.8% retracement at $78,490.
The weekly RSI is currently at 35, recovering from oversold levels, indicating downward pressure is waning. However, the MACD remains in a bearish crossover since mid-August, suggesting negative momentum has not fully dissipated.
On the daily chart, the short-term trend is neutral but leaning bearish, with prices oscillating within a parallel channel around $69,200. The price staying below the 50- and 100-day EMAs (ranging from $72,600 to $78,800) indicates the market is in a correction phase within a longer-term uptrend.
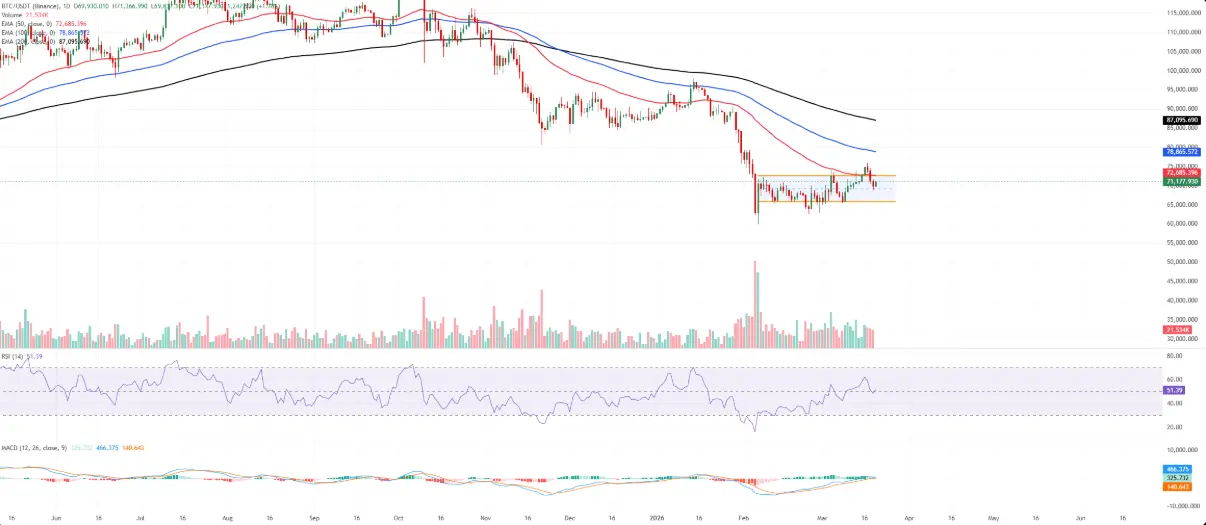 Daily BTC/USDT Chart | Source: TradingView The RSI remains around 51, reflecting balanced momentum, while the MACD stays positive but weakens, implying upward strength is gradually fading.
The nearest resistance is at the channel top around $72,600, coinciding with the 50-day EMA. A breakout above this zone could target the 100-day EMA near $78,800.
Support levels are at $69,200 and the channel bottom around $65,900. Losing these levels would increase the risk of a deeper correction, while holding them could allow the market to continue a correction within the overall uptrend.
