Because the United States holds a central position in the global financial system, movements in US30 often reflect more than just the performance of a single stock market. They can influence global investor sentiment through a chain reaction. Corporate earnings reports, macroeconomic data, and shifts in monetary policy can all quickly feed into market expectations through this index.
Compared to other indices, US30 is composed primarily of mature blue-chip companies, making it a key indicator of traditional industries and large-scale corporate performance. It is often used by investors to assess market trends and macroeconomic cycles.
From a structural perspective, US30 has also become an important bridge between traditional capital markets and modern digital trading infrastructure. Through instruments such as index futures, Contracts for Difference (CFDs), and ETFs, traders can participate in index movements using margin and leverage. This significantly enhances capital efficiency and trading flexibility.
By turning macroeconomic indicators into tradable assets, US30 allows investors not only to track the U.S. economy but also to build long and short strategies based on global liquidity and market sentiment. As a result, it serves both as a benchmark indicator and an active trading instrument in modern financial markets.
What Is US30?
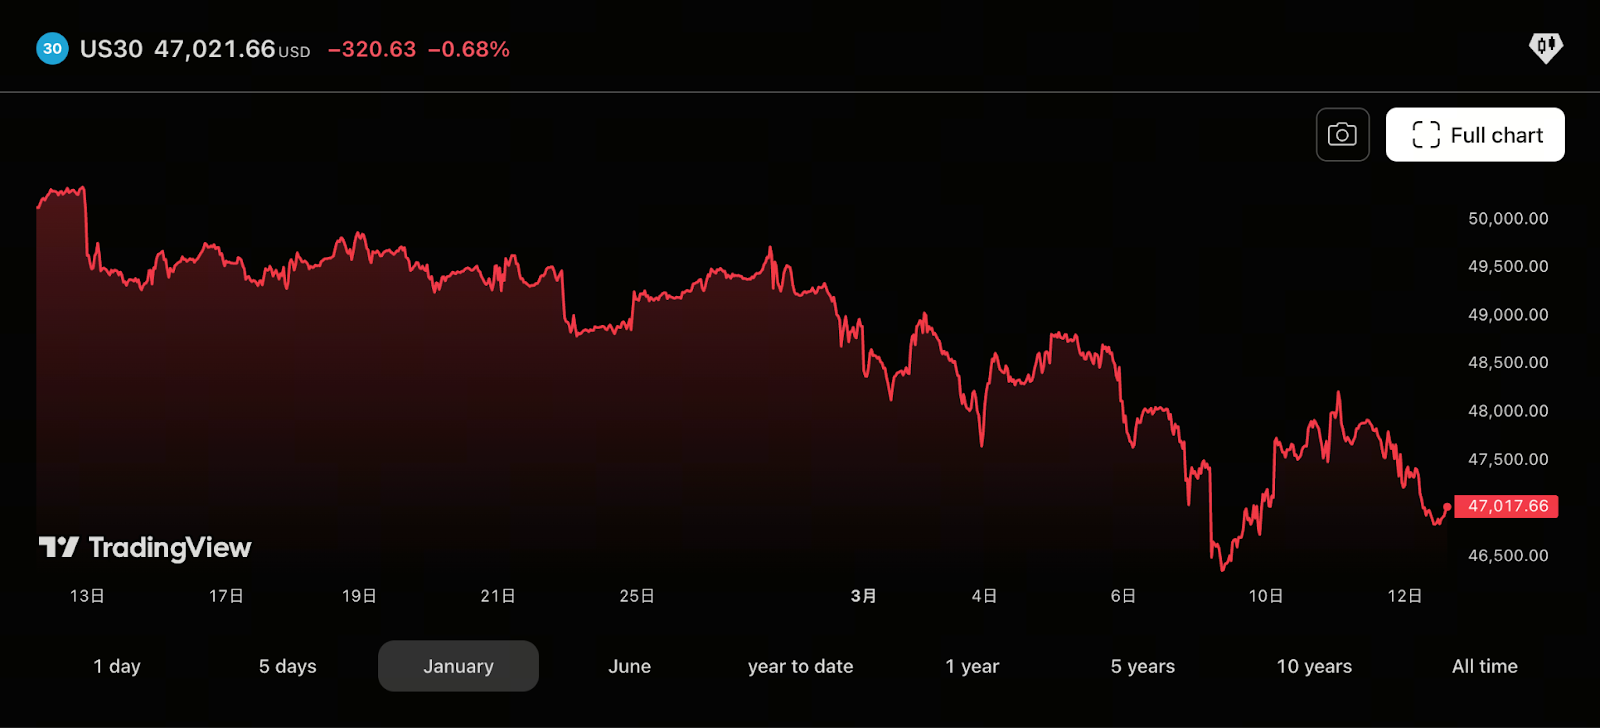 (Source: TradingView)
As one of the most recognized stock indices globally, the Dow Jones Industrial Average, commonly shown as US30 on trading platforms, reflects the overall performance of major U.S. blue-chip companies. The index includes 30 influential corporations across sectors such as technology, finance, consumer goods, and industrials, making it a key barometer of U.S. economic health.
Given the central role of the U.S. economy in the global financial system, movements in US30 often impact not only domestic markets but also global capital sentiment. For investors, it serves both as a benchmark for market trends and as a tradable instrument tied to macroeconomic cycles.
How Does US30 Work? Core Mechanism Explained
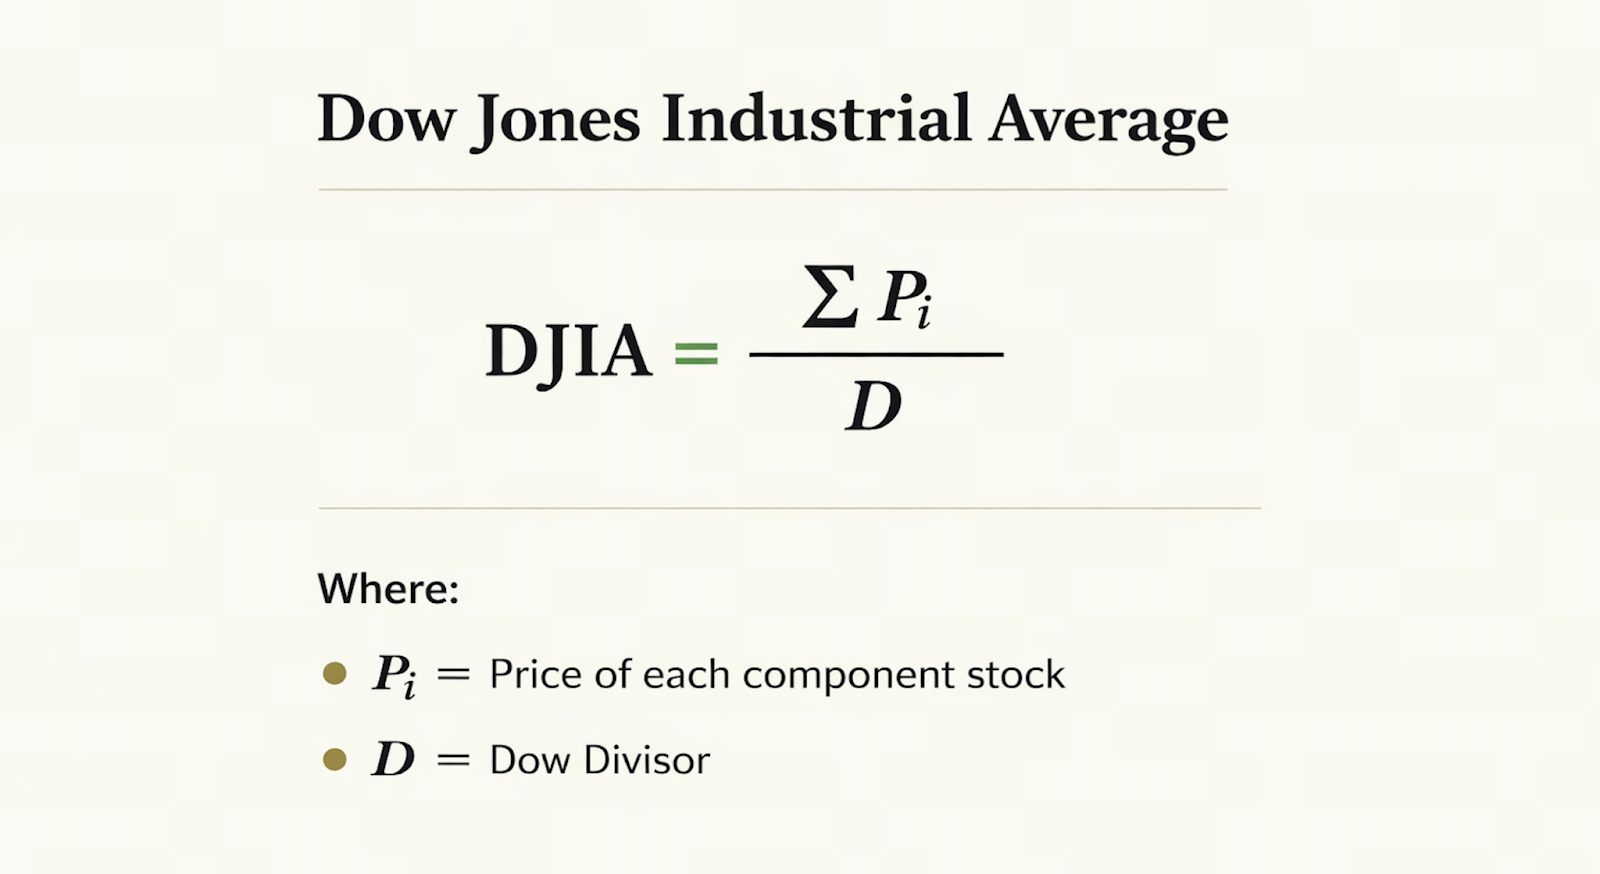
Unlike many market-cap-weighted indices, the Dow Jones Industrial Average uses a price-weighted methodology. Each component stock influences the index based on its share price rather than its total market capitalization.
When component stock prices change, the index is adjusted using a specific divisor, known as the Dow Divisor, to maintain continuity after events such as stock splits or structural changes.
The index composition is periodically reviewed and adjusted by S&P Dow Jones Indices to ensure it continues to represent leading U.S. companies. In practice, traders gain exposure to US30 through financial instruments such as index futures, CFDs, and ETFs, enabling both directional trading and hedging strategies.
Contract Specifications
In trading markets, US30 is typically offered through index CFDs or futures contracts. While exact parameters may vary by platform, the overall structure remains similar.
US30 contracts are quoted in index points. A movement of one point corresponds to a specific monetary gain or loss, depending on contract size. Traders can take long or short positions and use leverage to amplify exposure to price movements.
Contracts also define key parameters such as minimum lot size, point value, trading hours, and overnight holding costs. These elements form the foundation of US30 trading conditions.
Because US30 tracks major U.S. companies, its trading hours closely align with U.S. stock market sessions, with strong liquidity across global trading periods.
How Is Margin Calculated?
When trading US30-related derivatives, margin represents the capital required to open a position. In general, margin is calculated based on the contract’s notional value and the leverage used:
Required Margin = Total Contract Value ÷ Leverage
For example, if the index is priced at 38,000 points and each point has a defined monetary value, opening one contract results in a specific notional exposure. With 1:100 leverage, a trader may only need to commit approximately 1 percent of the total contract value to open the position.
While leverage increases capital efficiency, it also magnifies risk. As a result, traders often combine position sizing and risk management strategies to avoid margin calls or forced liquidation during volatile market conditions.
Key Factors That Influence US30
-
U.S. Economic Data
Important indicators include Non-Farm Payrolls (NFP), unemployment rates, and inflation data such as CPI. Strong data typically boosts market confidence and supports the index, while weak data may pressure it.
-
The index includes major corporations such as Apple Inc., Microsoft, Boeing, and McDonald’s. Strong earnings across these companies tend to push the index higher, while weak performance can drag it down.
-
Federal Reserve Interest Rate Policy
The Federal Reserve holds multiple rate meetings each year:
Interest rate cycles typically have a medium- to long-term impact on the index.
-
External Factors
Political developments, trade tensions, geopolitical risks, and shifts in market sentiment can all influence US30, sometimes causing sharp short-term volatility.
How to Trade US30
The Dow Jones Industrial Average itself is not directly tradable. Instead, investors participate through derivative instruments such as index futures, CFDs, or ETFs. These tools allow traders to take long or short positions based on market expectations.
In practice, traders often combine macroeconomic data, corporate earnings, interest rate policy, and market sentiment to form trading strategies. For example, strong economic data and corporate performance may drive bullish sentiment, while uncertainty can increase volatility.
Successful US30 trading typically involves both technical analysis and a broader understanding of global economic conditions.
US30 vs NASDAQ: Similarities and Differences
Both the Dow Jones Industrial Average and the NASDAQ Composite are key indicators of U.S. market performance and receive significant global attention. They share the common role of reflecting overall corporate trends in the United States.
However, they differ in structure and market characteristics. US30 consists of 30 large, established blue-chip companies with relatively balanced sector exposure, making it more stable overall. In contrast, the NASDAQ index includes a high concentration of technology and growth companies, such as those in internet, semiconductor, and software industries, resulting in higher volatility.
For investors, US30 represents traditional large-cap economic strength, while NASDAQ serves as a window into technology and growth sectors.
Advantages and Risks of US30
The Dow Jones Industrial Average offers several advantages. It is composed of leading U.S. blue-chip companies, providing a relatively stable and mature representation of the economy. It also benefits from high global recognition, strong liquidity, and extensive historical data, making it suitable for long-term analysis.
A wide range of investment products is available, including the SPDR Dow Jones Industrial Average ETF Trust and E-mini Dow Futures, both of which are actively traded worldwide.
However, there are also risks to consider. The index can experience sharp volatility during major events or economic releases. Its composition of only 30 stocks introduces a degree of concentration risk. External factors such as interest rate changes and geopolitical events can also significantly impact price movements.
Additionally, because US30 is price-weighted, higher-priced stocks can disproportionately influence the index, meaning weighting is not strictly based on company size.
When trading with leverage, potential losses are amplified alongside gains, making risk management and capital control essential.
Summary
US30 allows investors to participate in the price movements of the Dow Jones Industrial Average using margin-based instruments, offering high liquidity and global relevance. However, leveraged trading increases risk.
Before trading, it is important to understand contract specifications, margin mechanics, and the macroeconomic factors that drive market movements. Evaluating personal risk tolerance and maintaining disciplined risk management are essential.
When used responsibly, US30 can serve as both a strategic asset allocation tool and a vehicle for short-term trading opportunities.
FAQ
-
What is US30? US30 refers to the Dow Jones Industrial Average, one of the most representative stock indices globally. It consists of 30 major U.S. blue-chip companies and is widely used to track economic performance and market trends.
-
How can investors trade US30? US30 is not directly tradable. Investors typically gain exposure through derivatives such as index futures, CFDs, or ETFs like the SPDR Dow Jones Industrial Average ETF Trust. These instruments allow both long and short positions.
-
What factors influence US30? US30 is affected by macroeconomic data such as employment and inflation, corporate earnings, Federal Reserve interest rate policy, and broader geopolitical and market sentiment factors.