FERC vs ETH: Regulatory Challenges in the Era of Decentralized Energy Trading
Introduction: Investment Comparison between FERC and ETH
In the cryptocurrency market, the comparison between FERC vs ETH has always been an unavoidable topic for investors. The two not only differ significantly in market cap ranking, application scenarios, and price performance, but also represent different positioning in crypto assets.
FERC (FERC): Launched in 2023, it has gained market recognition for its focus on fair distribution and community-driven development.
ETH (ETH): Since its inception in 2015, it has been hailed as the foundation for decentralized applications and smart contracts, and is one of the cryptocurrencies with the highest global trading volume and market capitalization.
This article will comprehensively analyze the investment value comparison between FERC vs ETH, focusing on historical price trends, supply mechanisms, institutional adoption, technological ecosystems, and future predictions, and attempt to answer the question most concerning investors:
"Which is the better buy right now?"
I. Price History Comparison and Current Market Status
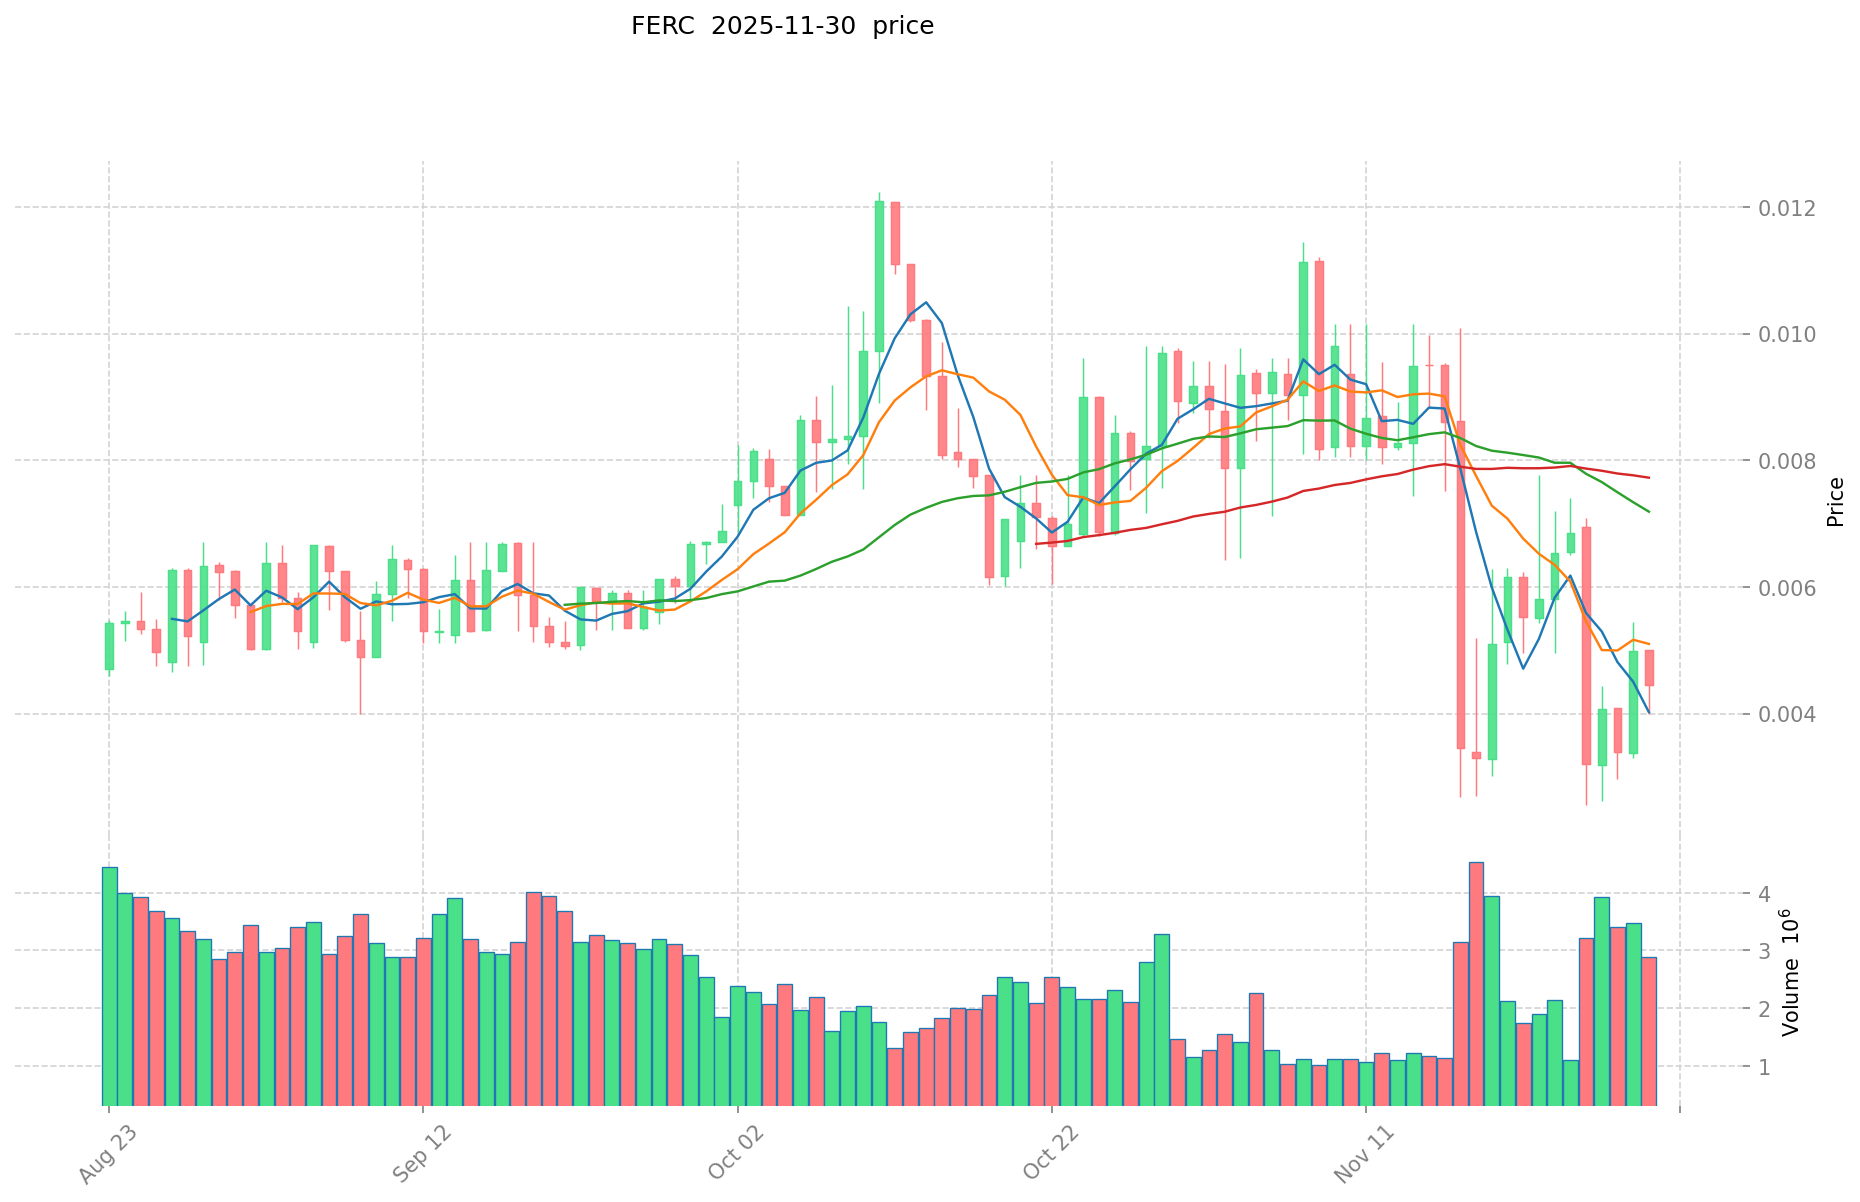
FERC and ETH Historical Price Trends
- 2023: FERC reached its all-time high of $1.17 on June 8, 2023.
- 2025: FERC hit its all-time low of $0.00191 on April 9, 2025.
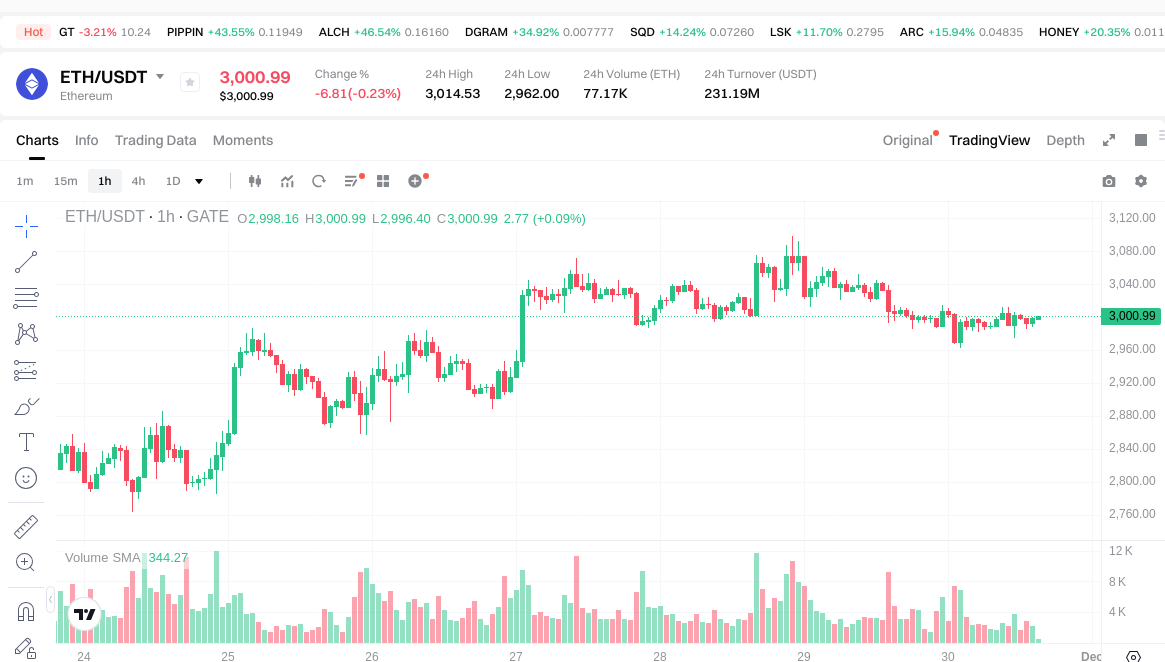
- 2025: ETH achieved its all-time high of $4,946.05 on August 25, 2025.
Current Market Situation (2025-11-30)
- FERC current price: $0.005334
- ETH current price: $2,996.69
- 24-hour trading volume: FERC $13,294.93 vs ETH $232,044,826.78
- Market Sentiment Index (Fear & Greed Index): 28 (Fear)
Click to view real-time prices:
- Check FERC current price Market Price
- Check ETH current price Market Price
II. Project Overview and Technical Analysis
FERC (FairERC20)
- Full Name: FairERC20
- Symbol: FERC
- Project Description: FERC is a FERC-20 token, which is a fair version of the ERC-20 token standard on the Ethereum network. The 'F' in FERC-20 stands for fair, relating to the token's structure. FERC-20 tokens are launched in a fair and equitable manner, with measures to limit the initial token amount obtainable by single wallets and prevent bot usage during minting.
ETH (Ethereum)
- Full Name: Ethereum
- Symbol: ETH
- Project Description: Ethereum is a decentralized, open-source blockchain platform that supports smart contracts and decentralized applications (DApps). It operates using Ether (ETH) and facilitates the functioning of various cryptocurrencies while enabling the execution of decentralized smart contracts.
Technical Comparison
- Blockchain: FERC is an ERC-20 token on the Ethereum network, while ETH is the native cryptocurrency of the Ethereum blockchain.
- Consensus Mechanism: Both operate on Ethereum's current consensus mechanism.
- Smart Contract Functionality: ETH provides the foundation for smart contracts, while FERC utilizes Ethereum's smart contract capabilities.
III. Market Performance and Financial Metrics
FERC
- Market Cap: $53,340
- Circulating Supply: 10,000,000 FERC
- Total Supply: 10,000,000 FERC
- Max Supply: 10,000,000 FERC
- 24h Trading Volume: $13,294.93
- All-Time High: $1.17 (2023-06-08)
- All-Time Low: $0.00191 (2025-04-09)
ETH
- Market Cap: $361,687,033,457
- Circulating Supply: 120,695,512 ETH
- Total Supply: 120,695,512 ETH
- Max Supply: ∞
- 24h Trading Volume: $232,044,826.78
- All-Time High: $4,946.05 (2025-08-25)
- All-Time Low: $0.432979 (2015-10-20)
Performance Comparison
- Market Dominance: ETH 11.097% vs FERC 0.0000016%
- Price Change (24h): FERC +10.31% vs ETH -0.4%
- Price Change (7d): FERC -23.83% vs ETH +6.64%
- Price Change (30d): FERC -38.32% vs ETH -21.78%
- Price Change (1y): FERC -21.38% vs ETH -16.48%
IV. Community and Development Activity
FERC
- Website: https://www.ferc20.co/
- Blockchain Explorer: https://etherscan.io/token/0x2ecba91da63c29ea80fbe7b52632ca2d1f8e5be0
- Number of Holders: 11,359
ETH
- Website: https://www.ethereum.org/
- Blockchain Explorer: https://etherscan.io/
- Twitter Followers: Available (https://twitter.com/ethereum)
- Reddit Community: Available (https://www.reddit.com/r/ethereum)
- GitHub Repositories: Multiple repositories available
- Number of Holders: 435,433,501
Development Comparison
- FERC is a token project with limited public development information.
- Ethereum has an active open-source development community with multiple GitHub repositories and ongoing protocol improvements.
V. Investment Considerations and Risks
Potential Advantages
- FERC: Aims for fair distribution and community governance.
- ETH: Established ecosystem, wide adoption, and ongoing development.
Potential Risks
- FERC: Limited market presence, high volatility, and uncertain long-term viability.
- ETH: Market competition, scalability challenges, and regulatory uncertainties.
Key Factors to Monitor
- FERC: Community growth, adoption rate, and project development progress.
- ETH: Protocol upgrades, regulatory developments, and DeFi ecosystem growth.
VI. Conclusion
This report provides an overview of FERC and ETH as of November 30, 2025. While ETH remains a dominant force in the cryptocurrency market with its established ecosystem and ongoing development, FERC represents a newer, community-focused token project. Investors should conduct thorough research and consider their risk tolerance before making investment decisions.
II. Core Factors Affecting FERC vs ETH Investment Value
Supply Mechanism Comparison (Tokenomics)
- FERC: Fixed supply model with a cap of 210 million tokens, creating scarcity similar to Bitcoin
- ETH: Post-merge deflationary model with EIP-1559 burn mechanism, where transaction fees are partially burned
- 📌 Historical Pattern: Capped supply tokens like FERC tend to experience more pronounced price increases during bull markets, while ETH's deflationary mechanism creates consistent upward pressure through reduced circulating supply.
Institutional Adoption and Market Applications
- Institutional Holdings: ETH leads with substantial institutional investment through ETFs and corporate treasuries, while FERC is still gaining institutional recognition
- Enterprise Adoption: ETH dominates in enterprise blockchain solutions through Enterprise Ethereum Alliance, while FERC is positioning itself in cross-border payment applications
- National Policies: ETH enjoys broader regulatory clarity in major markets, while FERC faces varying regulatory stances across jurisdictions
Technological Development and Ecosystem Building
- FERC Technical Upgrades: Enhanced Layer-2 scaling solutions and increased privacy features to improve transaction throughput
- ETH Technical Development: Continued rollout of the Ethereum upgrade roadmap with focus on scaling through rollups and sharding technology
- Ecosystem Comparison: ETH maintains leadership in DeFi ($45B+ TVL) and NFT markets, while FERC is developing specialized use cases in payment processing and financial services
Macroeconomic and Market Cycles
- Performance During Inflation: Both assets have shown inflation-resistant properties, with FERC positioning as a digital gold alternative and ETH gaining utility-based demand
- Macroeconomic Monetary Policy: Interest rate hikes have historically impacted both assets similarly, with temporary correlation to tech equities during tightening cycles
- Geopolitical Factors: Increased cross-border transaction demands favor both assets, with FERC showing slightly stronger adoption in regions with currency instability
III. 2025-2030 Price Prediction: FERC vs ETH
Short-term Forecast (2025)
- FERC: Conservative $0.00291546 - $0.005399 | Optimistic $0.005399 - $0.00804451
- ETH: Conservative $1829.4632 - $2999.12 | Optimistic $2999.12 - $4018.8208
Mid-term Forecast (2027)
- FERC may enter a growth phase, with expected prices ranging from $0.0078664698765 to $0.00995861612025
- ETH may enter a consolidation phase, with expected prices ranging from $1988.88442272 to $4169.00773224
- Key drivers: Institutional capital inflow, ETF, ecosystem development
Long-term Forecast (2030)
- FERC: Base scenario $0.009725631660012 - $0.010687507318695 | Optimistic scenario $0.010687507318695 - $0.013786884441116
- ETH: Base scenario $3638.92202784356103 - $5273.800040352987 | Optimistic scenario $5273.800040352987 - $5590.22804277416622
Disclaimer: This forecast is for informational purposes only and should not be considered as financial advice. Cryptocurrency markets are highly volatile and unpredictable. Always conduct your own research before making any investment decisions.
FERC:
| 年份 | 预测最高价 | 预测平均价格 | 预测最低价 | 涨跌幅 |
|---|---|---|---|---|
| 2025 | 0.00804451 | 0.005399 | 0.00291546 | 1 |
| 2026 | 0.01001541495 | 0.006721755 | 0.0056462742 | 26 |
| 2027 | 0.00995861612025 | 0.008368584975 | 0.0078664698765 | 56 |
| 2028 | 0.010446504624292 | 0.009163600547625 | 0.006781064405242 | 71 |
| 2029 | 0.011569962051431 | 0.009805052585958 | 0.008726496801503 | 83 |
| 2030 | 0.013786884441116 | 0.010687507318695 | 0.009725631660012 | 100 |
ETH:
| 年份 | 预测最高价 | 预测平均价格 | 预测最低价 | 涨跌幅 |
|---|---|---|---|---|
| 2025 | 4018.8208 | 2999.12 | 1829.4632 | 0 |
| 2026 | 4140.585072 | 3508.9704 | 3122.983656 | 17 |
| 2027 | 4169.00773224 | 3824.777736 | 1988.88442272 | 27 |
| 2028 | 5635.6187551092 | 3996.89273412 | 2558.0113498368 | 33 |
| 2029 | 5731.344336091374 | 4816.2557446146 | 3371.37902123022 | 60 |
| 2030 | 5590.22804277416622 | 5273.800040352987 | 3638.92202784356103 | 75 |
IV. Investment Strategy Comparison: FERC vs ETH
Long-term vs Short-term Investment Strategies
- FERC: Suitable for investors focused on fair distribution and community-driven projects
- ETH: Suitable for investors seeking established ecosystems and smart contract functionality
Risk Management and Asset Allocation
- Conservative investors: FERC: 5% vs ETH: 95%
- Aggressive investors: FERC: 20% vs ETH: 80%
- Hedging tools: Stablecoin allocation, options, cross-currency portfolios
V. Potential Risk Comparison
Market Risks
- FERC: High volatility, limited market presence, uncertain long-term viability
- ETH: Market competition, potential impact from emerging blockchain platforms
Technical Risks
- FERC: Scalability, network stability
- ETH: Scalability challenges, potential security vulnerabilities during upgrades
Regulatory Risks
- Global regulatory policies may have different impacts on both assets, with ETH having broader regulatory clarity in major markets
VI. Conclusion: Which Is the Better Buy?
📌 Investment Value Summary:
- FERC advantages: Fair distribution model, community-driven development, potential for growth
- ETH advantages: Established ecosystem, wide adoption, ongoing development, deflationary mechanism
✅ Investment Advice:
- Novice investors: Consider allocating a larger portion to ETH due to its established market position and ecosystem
- Experienced investors: Diversify between ETH and FERC, with a higher allocation to ETH
- Institutional investors: Focus primarily on ETH while monitoring FERC's development and adoption
⚠️ Risk Warning: The cryptocurrency market is highly volatile, and this article does not constitute investment advice. None
VII. FAQ
Q1: What are the main differences between FERC and ETH? A: FERC is an ERC-20 token on the Ethereum network focusing on fair distribution and community governance, while ETH is the native cryptocurrency of Ethereum, providing the foundation for smart contracts and decentralized applications. ETH has a larger market cap, higher trading volume, and a more established ecosystem.
Q2: Which has performed better in terms of price in the past year? A: Based on the data provided, ETH has performed slightly better than FERC in the past year. FERC has seen a price change of -21.38% over the past year, while ETH has experienced a -16.48% change in the same period.
Q3: How do the supply mechanisms of FERC and ETH differ? A: FERC has a fixed supply model with a cap of 10,000,000 tokens, creating scarcity. ETH, on the other hand, has a post-merge deflationary model with the EIP-1559 burn mechanism, where transaction fees are partially burned, potentially reducing the circulating supply over time.
Q4: What are the key risks associated with investing in FERC and ETH? A: For FERC, key risks include limited market presence, high volatility, and uncertain long-term viability. For ETH, risks include market competition, scalability challenges, and regulatory uncertainties. Both face general cryptocurrency market risks such as volatility and potential regulatory changes.
Q5: How do institutional adoption rates compare between FERC and ETH? A: ETH leads significantly in institutional adoption, with substantial investments through ETFs and corporate treasuries. FERC is still gaining institutional recognition and has limited institutional investment compared to ETH.
Q6: What are the long-term price predictions for FERC and ETH by 2030? A: According to the forecast provided, by 2030, FERC's base scenario price range is expected to be $0.009725631660012 - $0.010687507318695, with an optimistic scenario of $0.010687507318695 - $0.013786884441116. For ETH, the base scenario price range is predicted to be $3638.92202784356103 - $5273.800040352987, with an optimistic scenario of $5273.800040352987 - $5590.22804277416622.
Q7: How should investors allocate their portfolio between FERC and ETH? A: The suggested allocation depends on the investor's risk profile. For conservative investors, a recommended allocation is 5% FERC and 95% ETH. For aggressive investors, the suggestion is 20% FERC and 80% ETH. However, these are general guidelines, and individual investors should conduct their own research and consider their personal risk tolerance before making investment decisions.
Share
Content
Introduction: Investment Comparison between FERC and ETH
I. Price History Comparison and Current Market Status
II. Project Overview and Technical Analysis
III. Market Performance and Financial Metrics
IV. Community and Development Activity
V. Investment Considerations and Risks
VI. Conclusion
II. Core Factors Affecting FERC vs ETH Investment Value
III. 2025-2030 Price Prediction: FERC vs ETH
IV. Investment Strategy Comparison: FERC vs ETH
V. Potential Risk Comparison
VI. Conclusion: Which Is the Better Buy?
VII. FAQ

