Beginner’s Guide to Candlestick Charts

2026-01-01 10:48:58
Crypto Trading
Crypto Tutorial
K-line
Spot Trading
Trading Bots
Article Rating : 4
52 ratings
Master reading candlestick charts for cryptocurrencies as a beginner. Uncover how to interpret candlestick patterns, apply technical analysis using candlesticks, and develop trading strategies on Gate. This is your complete guide for traders.
Beginner’s Guide to Candlestick Charts

Introduction

For newcomers to trading or investing, chart reading can seem daunting. Many rely on hunches and make investment decisions based on intuition. However, trading and investing are fundamentally about probability and risk management. That's why understanding how to read candlestick charts is essential for nearly any investment approach, no matter your experience level.

What Is a Candlestick Chart?

A candlestick chart is a financial chart that visually displays an asset’s price movement over a defined time interval. Each chart consists of candles, with each candle representing the same duration. Candles can depict any timeframe—ranging from seconds to years—making them versatile tools for different analytical strategies.

Candlestick charts trace back to the 17th century. They are widely credited to a Japanese rice trader named Homma, who used them to analyze rice prices. His concepts likely formed the foundation for today’s modern candlestick charts, which are now a cornerstone of technical analysis.

How Do Candlestick Charts Work?

Candlestick charts display four key price points within a specific timeframe. Each candle is constructed using these data points:

  1. Open — The initial trading price of the asset in the timeframe.
  2. High — The highest trading price of the asset recorded in the timeframe.
  3. Low — The lowest trading price of the asset recorded in the timeframe.
  4. Close — The final trading price of the asset in the timeframe.

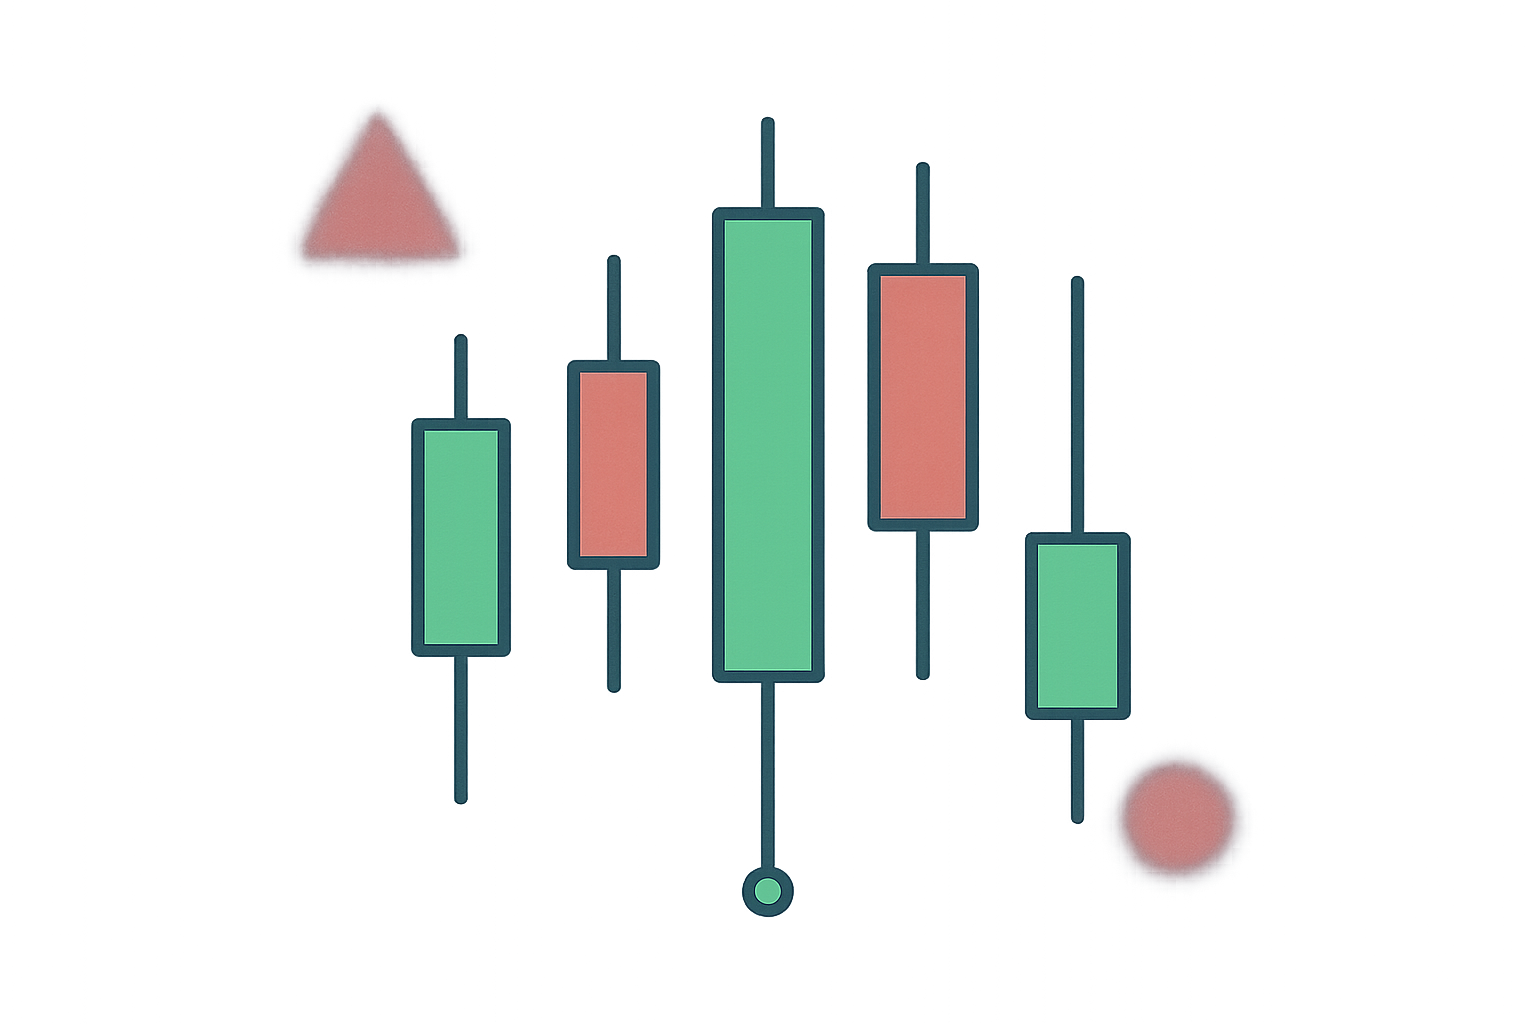
The distance between the open and close forms the “body,” while the space between these points and the high or low is known as the wick or shadow. This structure enables traders to quickly assess price direction and volatility for the analyzed period.

How to Read Candlestick Charts

Most traders find candlestick charts easier to interpret than traditional bar or line charts. Each candle reflects the struggle between buyers (bulls) and sellers (bears) within a specific period. A longer body signals stronger buying or selling momentum during that timeframe.

The color of the candle is crucial for reading market direction. A green body means the asset closed higher than it opened, indicating upward (bullish) pressure. Conversely, a red body shows the price fell during the period, with the close below the open, signaling downward (bearish) pressure. Wicks also offer insights into price rejection or reversal attempts.

What Candlestick Charts Don’t Reveal

While candlesticks give a useful overview of price action, they don’t offer every detail for thorough analysis. They only show the open and close distance, not the full price action between those points. This means significant price swings within the period may go unrepresented by the candle’s appearance.

Candlestick charts can also introduce substantial market noise, especially on shorter timeframes. This noise can trigger false signals that mislead less experienced traders. As a result, many analysts combine candlestick charts with other technical indicators and analysis tools for a more comprehensive market perspective.

Heikin-Ashi Candles

Heikin-Ashi, which translates to “average bar” in Japanese, refers to a modified candlestick chart that calculates candles using average price data. This approach distinguishes Heikin-Ashi from traditional Japanese candlesticks. Its main purpose is to smooth price movements and filter out market noise, giving a clearer view of underlying trends.

Traders frequently use Heikin-Ashi candles alongside standard candlesticks to avoid false signals and improve market trend detection. Green Heikin-Ashi candles without lower wicks generally signal a strong uptrend, while red candles without upper wicks can indicate a strong downtrend. This combination helps analysts pinpoint trend reversals with greater accuracy.

Conclusion

Candlestick charts are foundational tools for traders and investors aiming to understand market dynamics. They not only provide a clear visual record of an asset’s price action, but also allow flexible analysis across multiple timeframes, supporting a range of trading strategies.

Systematic study of candlestick charts and patterns, paired with analytical thinking and hands-on practice, can give traders a decisive edge. Mastering this core skill is a key step toward building a robust and profitable investment strategy.

FAQ

What is a candlestick chart and how does it work?

A candlestick chart visualizes price quotes using geometric shapes. The body shows the gap between open and close (green for rises, red for declines). Wicks mark the period’s highest and lowest prices, helping you analyze market moves.

What are the main components of a candlestick (open, close, high, low)?

Each candlestick consists of four key elements: open (starting price), close (ending price), high (maximum price), and low (minimum price) within a given period. These elements create the candle’s body and wicks.

What’s the difference between a bullish (green) and a bearish (red) candle?

A bullish (green) candle means the price closed above the open, indicating buyer strength. A bearish (red) candle means the price closed below the open, showing seller control.

A hammer pattern signals a bullish reversal after a drop; an inverted hammer points to a bearish reversal; a doji indicates market indecision when open and close are nearly equal. Always use these in conjunction with other analytical tools.

Which timeframes should beginners use to read candlestick charts?

As a beginner, start with 5- to 15-minute timeframes. These intervals highlight clear trends without overloading your analysis. Once comfortable, progressively move to longer timeframes like hourly or daily charts.

What are the most basic buy and sell signals in candlestick charts?

Basic buy signals include hammers at support levels, while shooting stars at resistance suggest sells. Also, look for small bodies with long wicks and shifts in trading volume to confirm trend changes.

* The information is not intended to be and does not constitute financial advice or any other recommendation of any sort offered or endorsed by Gate.
Related Articles
What is a red hammer Candlestick and how to use it

What is a red hammer Candlestick and how to use it

Understanding how the red hammer Candlestick pattern serves as a powerful bullish reversal signal is crucial for cryptocurrency traders operating in volatile markets. This article helps identify genuine red hammer patterns, emphasizing their formation after downtrends and at key support levels, and validating them with higher trading volume. Learn strategic trading implementation, utilizing technical indicators and risk management to enhance profitability. Gate's advanced tools assist in pattern recognition and real-time alerts. Optimize your trading approach through red hammer analysis to enhance your cryptocurrency investment strategy.
2025-11-03 03:11:16
Decoding the KDJ Indicator: A Comprehensive Guide

Decoding the KDJ Indicator: A Comprehensive Guide

"Decoding the KDJ Indicator" is a comprehensive guide for traders and analysts, focusing on the KDJ as a short-term analysis tool in financial markets. It explains the indicator's components: K-line, D-line, and J-line, and their roles in identifying overbought and oversold conditions. The article highlights key usage rules and signals like Golden and Death Crosses, and divergence detection. It also discusses the practical application of KDJ in day trading and crypto markets, guiding readers on decision-making with it and addressing FAQs for deeper understanding. Suitable for traders seeking clearer insights into price movements and market sentiment.
2025-11-26 09:10:48
How to Use the MACD Indicator for Crypto Trading Success

How to Use the MACD Indicator for Crypto Trading Success

The article delves into using the MACD indicator for successful crypto trading by breaking down its components: DIF, DEA, and histogram. It explains how these elements work together to identify market momentum and potential trading opportunities. Key insights include recognizing "golden cross" buy signals, leveraging MACD for analyzing market trends, and generating trading signals for optimal entry and exit points. The content is tailored for traders seeking actionable insights to enhance their trading strategies. This comprehensive guide emphasizes clear, structured analysis to facilitate informed trading decisions.
2025-12-02 09:23:50
Mastering the Exponential Moving Average (EMA): A Comprehensive Trading Strategy Guide

Mastering the Exponential Moving Average (EMA): A Comprehensive Trading Strategy Guide

This article serves as a comprehensive guide to mastering the Exponential Moving Average (EMA) as a trading strategy, highlighting its enhanced responsiveness to recent market changes. It addresses how EMA aids in trend identification, crossover strategies, and trading in volatile markets like cryptocurrency. The content is structured to first clarify what EMA is, followed by a step-by-step calculation guide, and practical examples in cryptocurrency trading. Ideal for traders seeking to refine their technical analysis skills, it also discusses combining EMA with other indicators for optimal trading decisions. Enhanced keyword density ensures clarity and readability for quick scanning.
2025-12-23 22:37:39
What Is a Breakout in the Cryptocurrency Sector?

What Is a Breakout in the Cryptocurrency Sector?

Explore the concept of breakouts in cryptocurrency markets and learn how to spot them to refine your trading strategies on Gate. Gain insights into the significance of trading volume, key pattern types, and practical methods to apply technical theory to your trades. Identify buy and sell signals and develop tactics to avoid false breakouts. Empower your trading decisions with this indispensable guide.
2025-12-23 11:31:09
Ultimate Guide to Understanding Popular Candlestick Patterns

Ultimate Guide to Understanding Popular Candlestick Patterns

# Ultimate Guide to Understanding Popular Candlestick Patterns Master candlestick analysis to elevate your trading on Gate. This comprehensive guide decodes essential candlestick patterns—from bullish hammers and three white soldiers to bearish shooting stars and dark cloud covers—enabling traders to identify trend reversals and continuations. Learn how to read candlestick charts, recognize bullish and bearish signals, and combine multiple patterns with technical indicators like RSI and MACD for stronger trade confirmation. Discover proven strategies for multi-timeframe analysis, risk management, and pattern implementation that work for both beginners and experienced traders seeking reliable technical analysis tools on Gate.
2025-12-26 18:36:34
Recommended for You
Former Nike and Apple Executive Gerardo Carucci Joins TON Foundation as CMO

Former Nike and Apple Executive Gerardo Carucci Joins TON Foundation as CMO

Gerardo Carucci, a seasoned marketing executive from Nike and Apple, has been appointed Chief Marketing Officer of the TON Foundation, a non-profit blockchain organization. His extensive experience in executing high-impact global campaigns, including Apple's Steve Jobs Theater launch and Nike's 2014 World Cup marketing initiative, positions him to revitalize TON's brand presence and user engagement. This strategic appointment addresses TON Foundation's recent challenges in activity metrics by combining proven consumer-marketing expertise with blockchain-specific community engagement. Backed by institutional confidence from investors like Sequoia and Pantera Capital, Carucci's human-centered marketing approach aims to make TON blockchain technology more accessible to mainstream audiences while driving developer and user acquisition. His leadership is expected to accelerate TON's growth within the Web3 ecosystem and strengthen its competitive market position.
2026-01-11 04:53:04
The Altseason Index has hit its highest point of the year, fueling optimism among traders.

The Altseason Index has hit its highest point of the year, fueling optimism among traders.

Discover when crypto altseason starts. Analyze the 2024 Altseason Index, recognize key signals indicating the onset, explore altcoin trading strategies on Gate, and review market outlook forecasts.
2026-01-11 04:49:58
FOMC Reduces Rates by 25 Basis Points, Influencing Cryptocurrency Markets

FOMC Reduces Rates by 25 Basis Points, Influencing Cryptocurrency Markets

This article explores how FOMC interest rate decisions reshape cryptocurrency markets through liquidity and investor behavior shifts. When the Federal Reserve cuts rates by 25 basis points, it lowers borrowing costs and increases dollar liquidity, prompting investors to seek higher-yield alternative assets like Bitcoin and Ethereum. The piece examines the cascading effects: weakened traditional fixed-income returns drive capital toward risk assets, institutional investors increase crypto allocations, and DeFi protocols become more competitive. Perfect for crypto investors, institutional fund managers, and traders seeking to understand macroeconomic policy impacts on digital assets. The analysis covers market implications, institutional demand trends, and DeFi opportunities while addressing common questions about rate cuts and cryptocurrency performance correlations.
2026-01-11 04:48:16
N4T Unveils the World's First Peace Prize Token on Ethereum

N4T Unveils the World's First Peace Prize Token on Ethereum

Explore N4T, the first peace prize token built on the Ethereum blockchain. Find out how to purchase N4T, unlock the advantages of ERC-20, and understand its fair distribution system. Become part of the peaceful crypto community on Gate today.
2026-01-11 04:46:48
Whale.Guru Predicts XRP to Hit $5 by End of 2025

Whale.Guru Predicts XRP to Hit $5 by End of 2025

Whale.Guru, a renowned market analyst, projects XRP could reach $5 by end of 2025, representing a 103% increase from current levels around $2.47. This forecast forms part of a broader bullish outlook including Bitcoin at $250,000 and Ethereum at $6,000. The prediction is grounded in realistic market fundamentals rather than speculation. Supporting factors include XRP's utility in cross-border payments, established financial partnerships, improved regulatory clarity, and institutional adoption growth. The projection aligns with convergent views from other prominent analysts like Ash Crypto and Mario Nawfal, suggesting growing consensus within the crypto community. XRP's fast transaction speeds and lower fees position it competitively, though regulatory uncertainties and market volatility remain key considerations. Success depends on sustained adoption, favorable regulatory environment, and broader cryptocurrency market strength, particularly Bitcoin's performance as a leading indicator.
2026-01-11 04:45:22
673 BTC Worth $63.9 Million Transferred to Antpool

673 BTC Worth $63.9 Million Transferred to Antpool

This article examines a significant 673 BTC transfer valued at $639 million to Antpool, a major Bitcoin mining pool operated by Bitmain Technologies. The analysis explores the transaction's potential motivations, ranging from reward consolidation to strategic asset reallocation within mining operations. Large-scale Bitcoin movements to mining pools differ from exchange transfers, typically indicating long-term holding strategies rather than immediate liquidation pressure. The article contextualizes this transfer within the broader cryptocurrency ecosystem, discussing operational dynamics of industrial-scale mining and market implications. Readers gain insights into blockchain transparency, whale movement analysis, and how to interpret on-chain data through whale watching tools. Whether you're a crypto investor, miner, or analyst, this guide clarifies why major Bitcoin transfers matter and how to track them effectively on the blockchain network.
2026-01-11 04:43:57