


Ripple (XRP) Обновление рынка – 29 апреля 2026 года
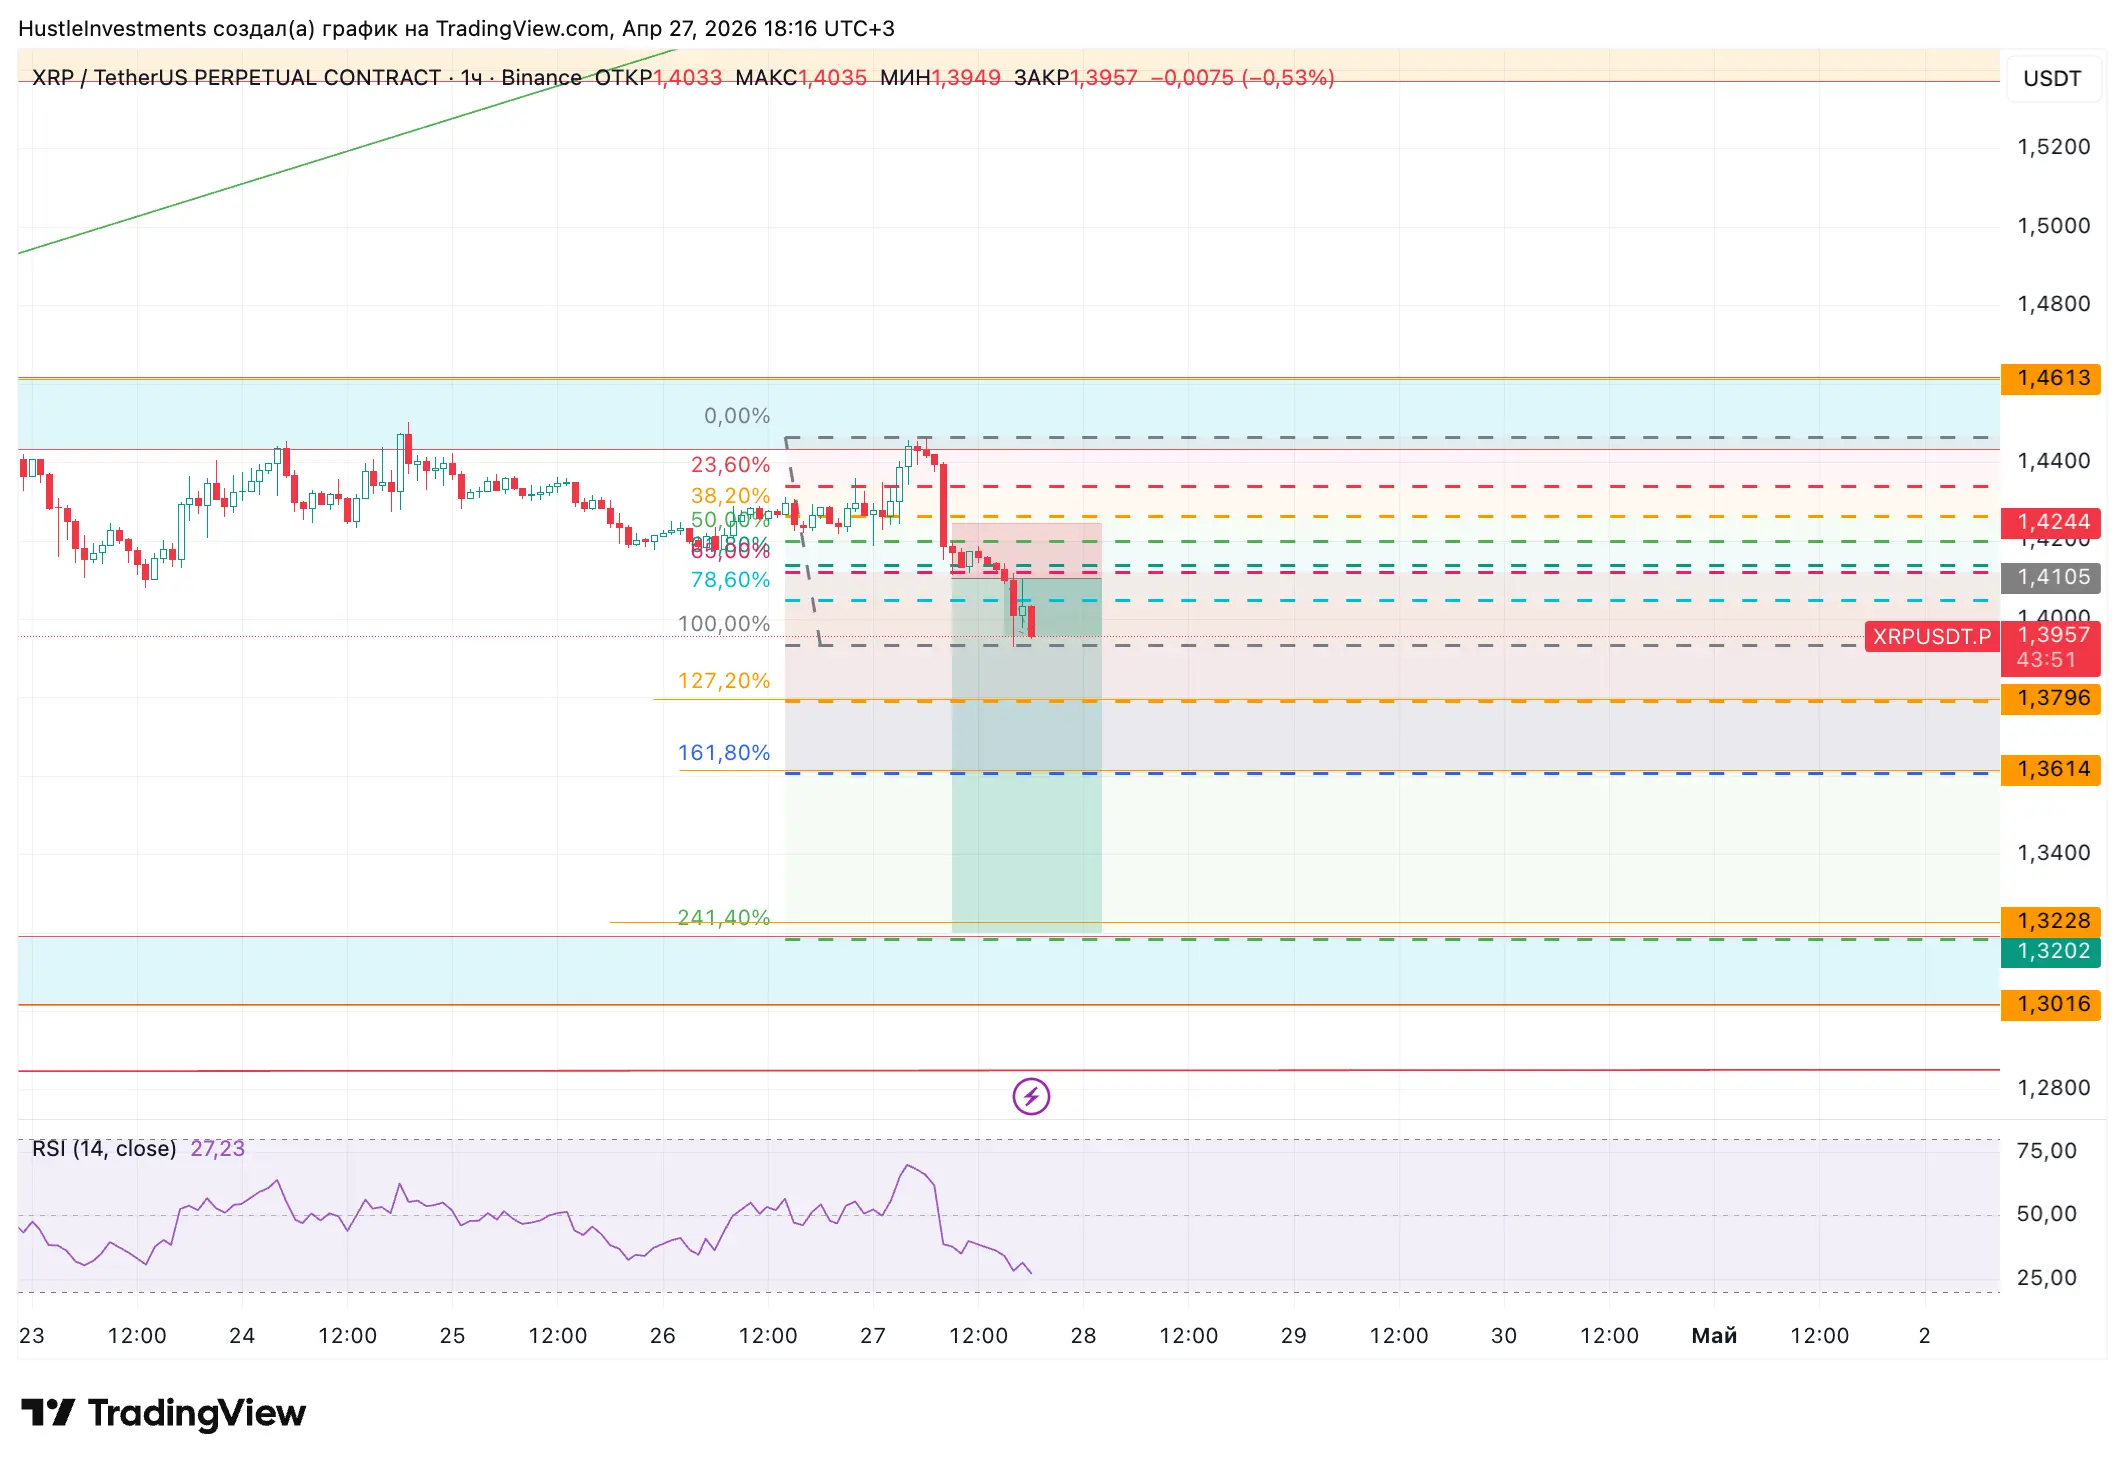
Цена: торгуется в диапазоне 1.39 – 1.42 USD, рост на 0.52% за последние 24 часа
1. Текущие уровни поддержки и сопротивления
Основная зона сопротивления находится между 1.60 и 1.75 USD. Эта область совпадает с 100-дневной экспоненциальной скользящей средней на уровне 1.52 USD, 200-дневной экспоненциальной скользящей средней на уровне 1.75 USD и верхней границей нисходящего канала. Также здесь отображается карта тепла стоимости Glassnode, показывающая концентрацию 9.9 миллиона XRP около 1.60 USD, создавая сильную зону предложения.
Психологическое сопротивление расположено в диапазоне 1.48 – 1.53 USD. Верхняя полоса Боллинджера находится на уровне 1.48 USD, 100-дневная экспоненциальная скользящая средняя — на 1.53 USD, а здесь расположена горизонтальная зона предложения. Закрытие дня выше 1.48 USD открывает цели в диапазоне 1.61 и 1.76 USD.
Промежуточное сопротивление находится в диапазоне 1.43 – 1.45 USD. 50-дневная экспоненциальная скользящая средняя — на 1.41 USD, а уровень пробоя нисходящей трендовой линии — на 1.43 USD. Сильное закрытие выше этой зоны откроет путь к 1.53 USD.
Немедленная поддержка расположена в диапазоне 1.38 – 1.41 USD. 50-дневная экспоненциальная скользящая средняя — на 1.41 USD, а средняя линия Боллинджера — на 1.40 USD. Цена в настоящее время тестирует чуть ниже этой средней.
Сильная поддержка находится в диапазоне 1.30 – 1.32 USD. Горизонтальный уровень на 1.30 USD, индикатор SuperTrend на 1.31 USD и нижняя полоса Боллинджера на 1.32 USD — все пересекаются здесь. Закрытие ниже 1.30 USD ослабит структуру.
Критическая поддержка расположена между 1.13 и 1.20 USD. Следующая цель коррекции по волне Эллиотта — 1.13 USD. На трехдневном графике уровень Фибоначчи 0.702 показывает концентрацию ликвидности между 0.73 USD и 1.13 USD.
Правило: Пока цена остается выше 1.41 USD, структура сохраняется. Сильное закрытие выше 1.45 USD откроет диапазон 1.53 – 1.60 USD. Закрытие ниже 1.30 USD увеличит риск достижения 1.13 USD и 0.90 USD.
2. Структурный взгляд с использованием уровней Фибоначчи
Используя максимум января 2026 года в 3.40 USD и минимум февраля 2026 года в 0.79 USD:
Уровень отката 23.6% — на 1.38 USD. Цена в настоящее время ищет баланс здесь.
Уровень отката 38.2% — на 1.53 USD. Совпадает с 100-дневной экспоненциальной скользящей средней и выступает в качестве основного сопротивления.
Уровень отката 50% — на 1.76 USD. Это верхняя граница канала и 200-дневная экспоненциальная скользящая средняя.
Уровень отката 61.8% — на 2.00 USD. Это первая основная цель в бычьем сценарии.
Уровень отката 76.4% — на 2.41 USD. Это зона долгосрочного расширения.
В краткосрочной перспективе уровень 1.45 USD совпадает с уровнем 0.236 по Фибоначчи, и пробой откроет путь к 1.60 USD. На дневном графике закрытие ниже 1.30 USD делает следующей целью 1.13 USD на уровне 0.5 по Фибоначчи.
3. Рыночное настроение: сжатие и накопление
Участники XRP в настоящее время сосредоточены вокруг трех основных тем:
Первая — институциональные притоки. Спотовые ETF на XRP зафиксировали всего 1.44 миллиарда USD притоков. В апреле добавлено 75 миллионов USD. Общие активы составляют 1.1 миллиарда USD. Goldman Sachs и другие институты увеличивают позиции.
Вторая — накопление на блокчейне. Крупные кошельки собирали в среднем по 11 миллионов XRP ежедневно за последние 30 дней. Открытый интерес снизился с 10 миллиардов USD до 2.57 миллиарда USD. Леверидж был выведен, а спекуляции уменьшены. За один день было снято 35 миллионов XRP со счетов бирж. Это сигнализирует о переходе к долгосрочному хранению.
Третья — нерешительность розничных инвесторов. RSI находится в диапазоне 46–52, нейтрально. MACD в отрицательной зоне, но медленно теряет импульс. ADX — 8.55, что указывает на слабую силу тренда. Цена консолидируется между 1.30 и 1.48 USD уже 91 день. Такое сжатие обычно предвещает резкое движение.
1 мая 2026 года из эскроу будет разблокировано 1 миллиард XRP. Ripple обычно блокирует большую часть этих токенов, поэтому увеличение циркуляции ограничено. Кажется, рынок уже заложил этот сценарий в цену.
4. Текущие новости и катализаторы
Ripple проводит конференцию по XRP в Лас-Вегасе 30 апреля – 1 мая. На здании Resorts World размещены билборды с надписью “RAISE THE STANDARD”. Это повышает видимость институциональных участников.
Притоки в спотовые XRP ETF продолжаются уже пять недель. Данные CoinShares показывают, что продукты XRP перешли из состояния оттоков в притоки.
Решение Ripple по хранению для банков и интеграция с Aave укрепляют использование в реальном мире. В то время как Western Union запускает стейблкоин на Solana, сети межгосударственных платежей Ripple также расширяются.
На макроуровне: Goldman Sachs не ожидает снижения ставки до третьего квартала. Доминирование Bitcoin около 60%, а альткоины показывают выборочные движения. XRP остается относительно сильным во время откатов BTC.
5. Итоговые технические показатели – 29 апреля
RSI находится в диапазоне 47–54. Не в зоне перекупленности или перепроданности, показывает нейтральный импульс.
Гистограмма MACD в отрицательной зоне, но приближается к нулю. На 4-часовом графике наблюдается попытка пересечения сигнальной линии.
20-дневная простая скользящая средняя — на 1.40 USD, 50-дневная экспоненциальная — на 1.41 USD. Цена сжата между этими двумя уровнями.
100-дневная экспоненциальная скользящая средняя — на 1.52 USD. Этот уровень совпадает с верхней линией нисходящего канала и является первым важным сопротивлением.
200-дневная экспоненциальная скользящая средняя — на 1.75 USD. Это критический уровень для долгосрочного тренда. Закрытие недели выше него откроет путь к зоне предложения 2.60 – 2.80 USD.
Ichimoku: Цена ниже Kijun на 1.39 USD. Нижняя граница облака около 1.67 USD выступает в качестве сопротивления.
6. План сценариев
Бычий сценарий: сильный пробой диапазона 1.45 – 1.48 USD с объемами, цели — 1.53 USD, затем 1.61 USD и 1.76 USD. Закрытие недели выше 1.60 USD откроет путь к 2.00 USD. Для этого нужны продолжение притоков ETF и плавное разблокирование эскроу 1 мая.
Медвежий сценарий: закрытие дня ниже 1.38 USD тестирует уровни 1.32 USD, 1.30 USD и 1.13 USD. Потеря уровня 1.13 USD разрушит структуру и увеличит риск достижения 0.90 – 0.73 USD.
Сценарий консолидации: продолжение бокового движения между 1.38 и 1.45 USD. Формация треугольника продолжается уже 91 день. Пробой будет резким. Закрытие выше 1.45 USD благоприятствует покупателям, ниже 1.38 USD — продавцам.
7. Основные выводы
XRP ищет баланс около 1.41 USD. Уровень сопротивления в 1.48 USD удерживается уже несколько недель. Этот уровень — как технический, так и психологический барьер.
Институциональные притоки и оттоки на биржах поддерживают цену. Леверидж выведен, а накопление на споте увеличилось. Рынок находится в контролируемом сжатии между 1.30 и 1.48 USD.
Данные о ликвидациях: существует высокий риск длинных ликвидаций ниже 1.30 USD. Выше 1.48 USD возможен ускоренный закрытие коротких позиций.
Волатильность сокращается. Формация треугольника приближается к вершине. Пробой близок. Уровни триггера — 1.43 USD и 1.45 USD. Удержание выше них откроет диапазон 1.53 – 1.60 USD.
Итог: XRP находится в зоне принятия решений между 1.38 и 1.45 USD. Удержание выше 1.41 USD сохраняет активной цель в 1.53 USD. Закрытие ниже 1.30 USD увеличит риск достижения 1.13 USD. Направление рынка определит закрытие выше 1.45 USD или ниже 1.38 USD. Разблокировка эскроу 1 мая и решение FOMC могут стать катализаторами пробоя.
