


La anatomía de un día loco
30 de abril de 2026, quedará grabado en la historia de los mercados financieros globales como un día de volatilidad y resistencia sin precedentes. En medio de una inflación alimentada por la guerra, un crecimiento desacelerado y dilemas de los bancos centrales, el índice S&P 500 logró sacudirse toda esta incertidumbre en un solo día, superando los 7,200 puntos.
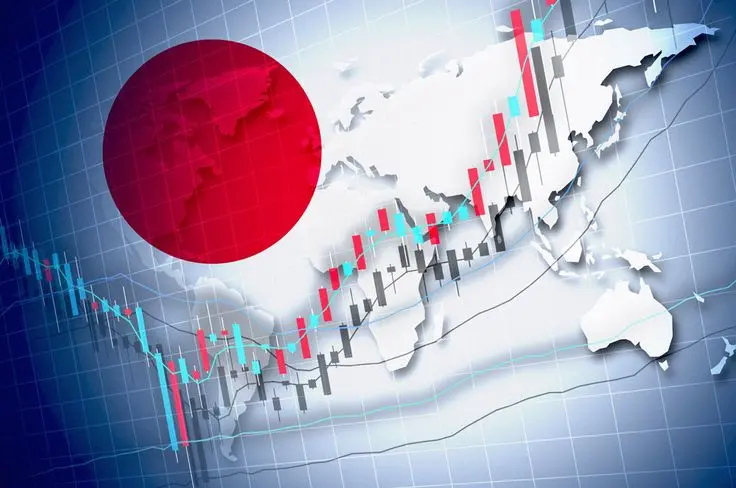
El colapso repentino provocado por un solo movimiento del BOJ
El punto de inflexión más crítico del día vino de Japón. El Banco de Japón (BOJ) y el Ministerio de Finanzas intervinieron directamente en el mercado de divisas por primera vez desde 2024, brindando apoyo al yen excesivamente depreciado. Este movimiento creó un efecto sísmico en el par USD/JPY; el par experimentó una caída abrupta de 160.72 a 155.55 en una sola vela.
Este movimiento repentino de la moneda desencadenó una reacción en cadena en los mercados globales. El miedo a un colapso repentino de décadas de "carry trade" en yen con bajos intereses provocó ventas de pánico en los mercados bursátiles estadounidenses. El índice S&P 500 perdió un 0.52% en solo 45 minutos, borrando aproximadamente 350 mil millones de dólares en capitalización de mercado.
Resurgiendo de las cenizas: una recuperación de 600 mil millones de dólares en 4 horas
Sin embargo, este colapso repentino fue seguido por una recuperación igualmente rápida. Los inversores compraron rápidamente, evaluando que la intervención de Japón no conduciría a una crisis de liquidez global y que los sólidos balances corporativos seguían formando los pilares de la economía. Una vez que la sacudida inicial disminuyó, el S&P 500 no solo borró sus pérdidas, sino que también recuperó más de 600 mil millones de dólares en capitalización de mercado en las siguientes cuatro horas, cerrando el día en un nuevo máximo histórico.
Detrás de esta recuperación extraordinaria estuvieron sólidos informes de ganancias de gigantes como Caterpillar, Alphabet, Eli Lilly y Qualcomm, superando las expectativas. Las inversiones de Alphabet en computación en la nube e inteligencia artificial, en particular, reforzaron la confianza en las acciones tecnológicas.
Un pico histórico en medio de todas las crisis
La imagen al final del día fue increíble. El S&P 500 cerró con un aumento del 1.02% en 7,209.01, superando por primera vez en su historia la marca de los 7,200 puntos. El índice Nasdaq Composite también alcanzó un nuevo máximo histórico, subiendo un 0.89% a 24,892.31. El índice Dow Jones cerró el día con un salto masivo de más de 790 puntos. Este rendimiento resultó en ganancias mensuales masivas del 10.4% para el S&P 500 y del 15.3% para el Nasdaq, marcando los mejores desempeños mensuales para los índices desde 2020. El valor de mercado del S&P 500 aumentó en más de 6 billones de dólares solo en abril.
Este rally ocurrió en un entorno que sorprendió incluso a los expertos más pesimistas:
• Guerra y crisis energética: Una guerra activa arde en Oriente Medio, y los precios del petróleo rondan los 120 dólares. • Señal de estanflación: La inflación PCE subyacente, vigilada de cerca por la Fed, saltó del 2.7% al 4.3% en un trimestre. • Crecimiento desacelerado: El PIB de EE. UU. perdió impulso en el primer trimestre, quedando por debajo de las expectativas. • Intervención global: La primera intervención del BOJ en el mercado de divisas destacó las tensiones en el sistema financiero global.
La clave del mercado: liquidez y optimismo en IA
Entonces, ¿cómo pueden los mercados subir a pesar de un panorama tan negativo? La respuesta radica en la abundancia de liquidez global y en la fe inquebrantable en la revolución de la inteligencia artificial. La expectativa de que los bancos centrales están cerca de finalizar su ciclo de aumento de tasas de interés, y los resultados tangibles que las empresas comienzan a ver de sus inversiones en IA, han eclipsado temporalmente los riesgos geopolíticos.
Como señaló Chris Zaccarelli de Northlight Asset Management, "Mientras la economía siga creciendo y las empresas aumenten sus ganancias, podríamos ver subir los precios de las acciones incluso frente a precios de energía más altos y la inflación."
El pico del 7,200 del S&P 500 pasará a la historia como prueba de la capacidad del mercado para absorber shocks a corto plazo y la confianza en un futuro impulsado por la IA. Sin embargo, los expertos advierten que si la guerra se prolonga y la inflación se vuelve aún más persistente, estas recuperaciones rápidas podrían dar paso a una tendencia a la baja más sostenida. Ahora, todos los ojos están puestos en si el S&P 500 podrá mantenerse en estos máximos históricos.
#Gate13周年现场直击 #Gate13 aniversario
30 de abril de 2026, quedará grabado en la historia de los mercados financieros globales como un día de volatilidad y resistencia sin precedentes. En medio de una inflación alimentada por la guerra, un crecimiento desacelerado y dilemas de los bancos centrales, el índice S&P 500 logró sacudirse toda esta incertidumbre en un solo día, superando los 7,200 puntos.
El colapso repentino provocado por un solo movimiento del BOJ
El punto de inflexión más crítico del día vino de Japón. El Banco de Japón (BOJ) y el Ministerio de Finanzas intervinieron directamente en el mercado de divisas por primera vez desde 2024, brindando apoyo al yen excesivamente depreciado. Este movimiento creó un efecto sísmico en el par USD/JPY; el par experimentó una caída abrupta de 160.72 a 155.55 en una sola vela.
Este movimiento repentino de la moneda desencadenó una reacción en cadena en los mercados globales. El miedo a un colapso repentino de décadas de "carry trade" en yen con bajos intereses provocó ventas de pánico en los mercados bursátiles estadounidenses. El índice S&P 500 perdió un 0.52% en solo 45 minutos, borrando aproximadamente 350 mil millones de dólares en capitalización de mercado.
Resurgiendo de las cenizas: una recuperación de 600 mil millones de dólares en 4 horas
Sin embargo, este colapso repentino fue seguido por una recuperación igualmente rápida. Los inversores compraron rápidamente, evaluando que la intervención de Japón no conduciría a una crisis de liquidez global y que los sólidos balances corporativos seguían formando los pilares de la economía. Una vez que la sacudida inicial disminuyó, el S&P 500 no solo borró sus pérdidas, sino que también recuperó más de 600 mil millones de dólares en capitalización de mercado en las siguientes cuatro horas, cerrando el día en un nuevo máximo histórico.
Detrás de esta recuperación extraordinaria estuvieron sólidos informes de ganancias de gigantes como Caterpillar, Alphabet, Eli Lilly y Qualcomm, superando las expectativas. Las inversiones de Alphabet en computación en la nube e inteligencia artificial, en particular, reforzaron la confianza en las acciones tecnológicas.
Un pico histórico en medio de todas las crisis
La imagen al final del día fue increíble. El S&P 500 cerró con un aumento del 1.02% en 7,209.01, superando por primera vez en su historia la marca de los 7,200 puntos. El índice Nasdaq Composite también alcanzó un nuevo máximo histórico, subiendo un 0.89% a 24,892.31. El índice Dow Jones cerró el día con un salto masivo de más de 790 puntos. Este rendimiento resultó en ganancias mensuales masivas del 10.4% para el S&P 500 y del 15.3% para el Nasdaq, marcando los mejores desempeños mensuales para los índices desde 2020. El valor de mercado del S&P 500 aumentó en más de 6 billones de dólares solo en abril.
Este rally ocurrió en un entorno que sorprendió incluso a los expertos más pesimistas:
• Guerra y crisis energética: Una guerra activa arde en Oriente Medio, y los precios del petróleo rondan los 120 dólares. • Señal de estanflación: La inflación PCE subyacente, vigilada de cerca por la Fed, saltó del 2.7% al 4.3% en un trimestre. • Crecimiento desacelerado: El PIB de EE. UU. perdió impulso en el primer trimestre, quedando por debajo de las expectativas. • Intervención global: La primera intervención del BOJ en el mercado de divisas destacó las tensiones en el sistema financiero global.
La clave del mercado: liquidez y optimismo en IA
Entonces, ¿cómo pueden los mercados subir a pesar de un panorama tan negativo? La respuesta radica en la abundancia de liquidez global y en la fe inquebrantable en la revolución de la inteligencia artificial. La expectativa de que los bancos centrales están cerca de finalizar su ciclo de aumento de tasas de interés, y los resultados tangibles que las empresas comienzan a ver de sus inversiones en IA, han eclipsado temporalmente los riesgos geopolíticos.
Como señaló Chris Zaccarelli de Northlight Asset Management, "Mientras la economía siga creciendo y las empresas aumenten sus ganancias, podríamos ver subir los precios de las acciones incluso frente a precios de energía más altos y la inflación."
El pico del 7,200 del S&P 500 pasará a la historia como prueba de la capacidad del mercado para absorber shocks a corto plazo y la confianza en un futuro impulsado por la IA. Sin embargo, los expertos advierten que si la guerra se prolonga y la inflación se vuelve aún más persistente, estas recuperaciones rápidas podrían dar paso a una tendencia a la baja más sostenida. Ahora, todos los ojos están puestos en si el S&P 500 podrá mantenerse en estos máximos históricos.
#Gate13周年现场直击 #Gate13 aniversario