Futures
Access hundreds of perpetual contracts
TradFi
Gold
One platform for global traditional assets
Options
Hot
Trade European-style vanilla options
Unified Account
Maximize your capital efficiency
Demo Trading
Introduction to Futures Trading
Learn the basics of futures trading
Futures Events
Join events to earn rewards
Demo Trading
Use virtual funds to practice risk-free trading
Launch
CandyDrop
Collect candies to earn airdrops
Launchpool
Quick staking, earn potential new tokens
HODLer Airdrop
Hold GT and get massive airdrops for free
Launchpad
Be early to the next big token project
Alpha Points
Trade on-chain assets and earn airdrops
Futures Points
Earn futures points and claim airdrop rewards
More
BTC Rebound Still in Correction Phase, HYPE Main Uptrend Initiated | Featured Analysis
Last week, the cryptocurrency market continued its oscillating trend. Bitcoin experienced a phased rebound after a rapid decline earlier, but from the overall structure and volume perspective, the current market remains in a weak sideways consolidation phase, and the mid-term trend has not fundamentally changed.
In this market environment, we continue to strictly follow our established trading system: on one hand, closely monitoring the HYPE Wave III main upward structure evolution, and on the other hand, engaging in short-term spread trading and medium-term trend position management around the BTC range-bound pattern.
This weekly report will systematically review and analyze last week’s market structure, trading execution, and potential market evolution paths for this week, providing corresponding trading strategy references.
Core Summary of the Trading Weekly Report:
• Deep analysis of HYPE multi-cycle trend structure: weekly tracking. (See Part One)
• Validation of HYPE short-term trading effectiveness: Last week, HYPE completed a short-term long position (1x leverage), achieving a profit of approximately 18.44%. (See Table 1)
• Validation of BTC short-term strategy execution: Last week, Bitcoin followed the established short-term strategy, completing a short position (1x leverage), with a profit of about 2.01%. (See Table 2)
• Validation of BTC medium-term strategy execution: Last week, Bitcoin continued holding the short position built at around $89,000 (1x leverage), with a profit of approximately 18.17% by week’s close (around $72,831), with a maximum profit of about 32.58% during the period.
• Core short-term viewpoint validation: Bitcoin maintained a weak range-bound oscillation last week. The current trend aligns with expectations.
• Market outlook and medium- and short-term trading strategies for this week.
I. HYPE: Trend Structure Analysis and Short-term Trading Review
• February 23 Weekly Review: First indicated that HYPE might enter an investment window, noting the market was in Wave II correction phase, with an anticipation of Wave III main upward movement.
• March 3 Weekly Review: Identified the February 24 low at $25.60 as a potential Wave III initiation point, confirming the trend reversal.
• March 9 Weekly Review: Noted that the price had effectively broken through multiple moving average resistances on the daily chart, entering a retracement consolidation phase, which is an energy accumulation process expected to lead to a rapid rise after completion.
• Wave I (Driving Wave): from the low of $20.46 on Jan 21 to the high of $38.41 on Feb 3, lasting 14 days, with a maximum increase of 87.73%.
• Wave II (Correction Wave): from the high of $38.41 on Feb 3 to the low of $25.60 on Feb 24, lasting 20 days, with a maximum decline of 33.35%.
• Wave III (Main Upward Wave): from the low of $25.60 on Feb 24 to the recent high of $38.85 on Mar 14, breaking above Wave I’s top of $38.41, confirming Wave III’s formation. As of now, 20 days into Wave III, with a maximum increase of 51.76%, the main upward trend continues.
[Insert HYPE 60-minute candlestick chart]
• Review of hourly trend structure (03.02–03.08): In the March 9 weekly review, we identified five adjustment segments (9-10, 10-11, 11-12, 12-13, 13-14). Analysis showed significant bottom divergence signals at the end of segment (9-10) and exit at (13-14). We judged that the correction likely ended at point 14 (~$29.67).
• From the low at point 14 (March 8), the upward move can be divided into 10 segments (14-15, 15-16, …, 23-24). These constitute the upward impulsive wave. As of analysis, this upward structure is still ongoing.
• Central structure: within these 10 segments, segments 19-20, 20-21, 21-22, 22-23, and 23-24 are forming an upward central zone.
Core view this week: The current market is in Wave III. After the central zone completes, the key will be whether the price can effectively break free from the zone’s gravitational pull. Expect a high probability of range-bound oscillation this week.
HYPE short-term trading review (1x leverage): (03.09–03.15)
Last week, based on our self-developed spread trading and momentum quantification models, combined with Wave III’s upward expectation, we executed a short-term long position, achieving an 18.44% profit.
[Insert Table 1]
• Entry decision (see Figure 2): The entry was validated by trend, structure, and quantitative signals: first, the hourly correction structure ended at point 14 (~$29.67); second, the price broke through the previous upper resistance (~$31.33); third, bottom resonance signals from spread and momentum models prompted us to open a 30% long position at $31.40.
• Exit decision: When the models indicated a top resonance near the Wave I top (~$38.41), and the price approached that level (~$37.19), we closed the position.
• Trade summary: Successfully captured Wave III upward opportunity, with about 18.44% profit.
[Insert short-term trading chart]
II. Bitcoin: Trend Structure Analysis and Medium-/Short-term Trading Review
We strictly followed our self-developed spread and momentum models, combined with market outlook, to execute a short (short) position last week, with a profit of 2.01%.
① Summary of Bitcoin short-term trades (leverage 1x):
[Insert Table 2]
② Short-term trade review (see Figure 3):
• Entry: Price rebounded near $74,500 but faced resistance; spread model triggered strong top warning signals (green dots), and both models’ short signals aligned, so we established a 30% short position at $72,496.
• Exit: Price fell to around $70,500, with spread model signaling bottom (red dots), and we closed all at $71,039.
[Insert 30-minute BTC candlestick chart with momentum and spread models]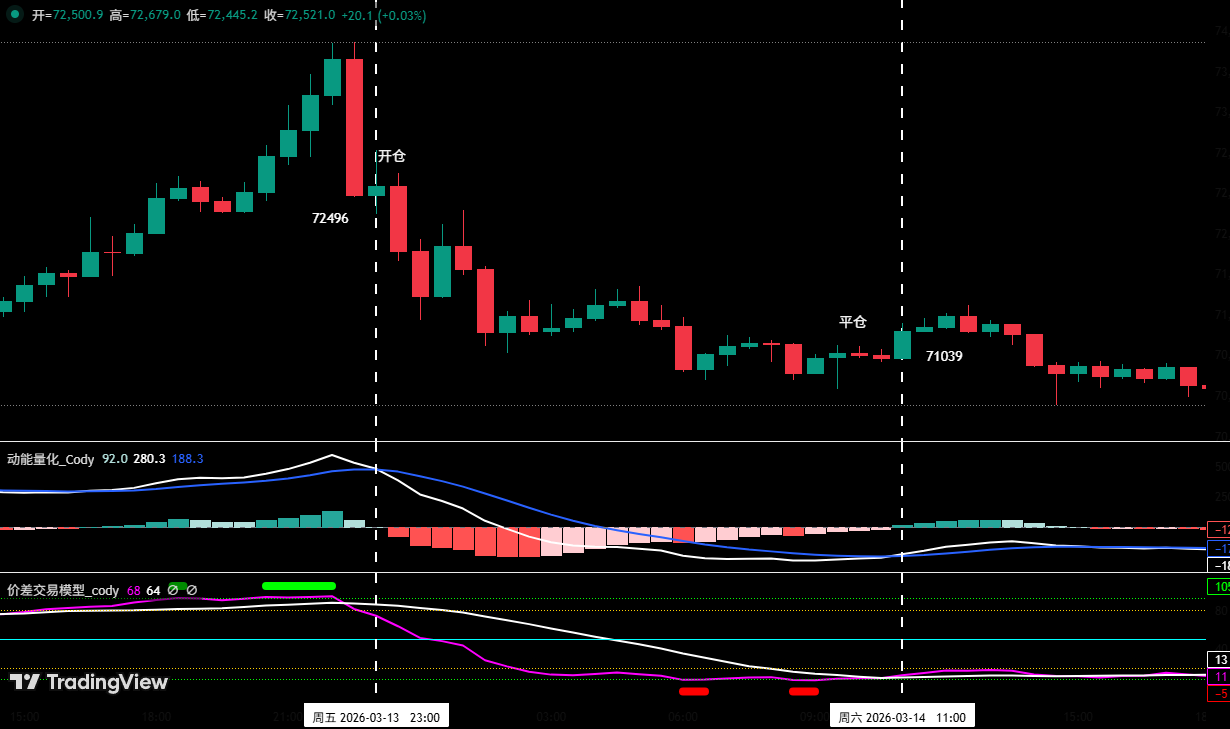
[Insert Figure 3]
Holding the 60% short position built at around $89,000 (January 28), with a profit of approximately 18.17% as of last week’s close (~$72,831).
III. Bitcoin: Weekly and Daily Technical Indicator Analysis
Using our proprietary trading system, combining multiple models and dimensions, we analyze Bitcoin’s technical indicators in depth.
[Insert weekly candlestick chart with momentum and sentiment models]
• Momentum model: Indicators show declining momentum, with the white momentum line flattening and negative energy bars shrinking, no divergence signals.
• Sentiment model: Blue sentiment line at 26, zero strength; yellow at 13, zero strength; peak at 0.
• Digital monitoring: Moving averages show a bearish alignment; last week’s large bullish candle (~10.39%) first broke above the 7-week moving average; no bottom signals.
Overall, the data indicates last week’s rebound was strong, with multiple technical indicators improving, easing oversold conditions. However, the weekly bearish trend remains intact, and the large bullish candle needs further confirmation for sustainability.
[Insert daily candlestick chart with momentum and sentiment models]
• Momentum: Last week, the overall pattern was “oscillating upward.” Momentum lines below zero are rising, with the white line crossing zero for the first time; positive energy bars are strengthening but weak.
• Sentiment: After Sunday, sentiment lines show blue at 31 and purple at 75, both with zero strength, with purple rising sharply.
Combined analysis suggests that despite the strong short-term rebound signals, daily volume did not expand proportionally, indicating the overall move remains within an oversold rebound range, not yet breaking out of the range-bound pattern. The daily trend is still bearish, with focus on the battle around the zero line.
IV. Market Forecast for This Week (03.16–03.22)
[Insert 4-hour candlestick chart]
• Central zone: Last week, the main structure was between segments 12-13. Currently, the zone is being built. Resistance moved up to ~$74,090; support around ~$62,500; upper boundary ~68,800; lower boundary ~66,250.
• Maintain previous core view: The rally from the Feb 6 low (~$60,000) is a large C wave correction, with C-2 wave being an oversold rebound, followed by C-3 wave decline.
• End of C-2 rebound: If price breaks below the lower support (~$66,250) and cannot re-establish above it, it signals a third type of sell point per Chánlùn theory, indicating strong downward momentum and likely end of the rebound.
Core view: Range-bound oscillation between $62,500 and $74,500, observing the battle near the edges; especially watch for a break below support (~$66,250). Strategy: stick to “reduce positions on rallies and control risk.”
Key resistance levels:
• First resistance: ~$74,500 (near previous lows)
• Second resistance: $79,500–$80,600 (near November 2025 lows)
• First support: ~$65,000
• Second support: $60,000–$62,500 (near Feb 6 low)
• Third support: ~$57,400
V. Trading Strategy for This Week (excluding unexpected news impact): (03.16–03.22)
[Insert daily candlestick chart with position monitoring model]
• Position monitoring: Currently, the price is below the bullish-bearish band (yellow). Continue holding the 60% short position established at ~$89,000 on Jan 28.
• If price rebounds above $74,500, reduce medium-term position to 40%.
• If price breaks above the band and stabilizes, close all medium-term positions.
Short-term strategy: Use 30% position with stop-loss based on support/resistance levels to seek spread opportunities (using 30-minute/60-minute cycles).
Given the overall bearish medium-term trend, and to adapt dynamically to market evolution, we propose two short-term plans:
Plan A: Resistance encounter, short on rallies.
• Entry: When price continues to rebound near $74,500 and triggers resistance signals, establish a 30% short.
• Risk control: Initial stop-loss at $76,000.
• Exit: When price approaches key support and signals, gradually close for profit.
Plan B: Breakout short position.
• Entry: When price breaks below support at ~$66,250 and retraces without re-establishing above, combined with top signals, establish a 30% short.
• Risk control: Stop-loss at $67,500.
• Exit: When price hits support and signals, gradually close for profit.
VI. Special Reminders:
When opening a position: immediately set initial stop-loss.
When profit reaches 1%: move stop-loss to breakeven (entry price).
When profit reaches 2%: move stop-loss to 1% profit level.
Continuously monitor: for each additional 1% profit, move stop-loss up by 1% to protect gains and lock in profits.
Financial markets are highly volatile; all analysis and strategies should be dynamically adjusted. All viewpoints, models, and operations in this document are based on personal technical analysis only, for personal trading logs, and do not constitute investment advice or recommendations. Market risks are inherent; please trade cautiously and do not base decisions solely on this content.