Trade
Basic
Futures
Futures
Hundreds of contracts settled in USDT or BTC
Options
HOT
Trade European-style vanilla options
Unified Account
Maximize your capital efficiency
Demo Trading
Futures Kickoff
Get prepared for your futures trading
Futures Events
Participate in events to win generous rewards
Demo Trading
Use virtual funds to experience risk-free trading
Earn
Launch
CandyDrop
Collect candies to earn airdrops
Launchpool
Quick staking, earn potential new tokens
HODLer Airdrop
Hold GT and get massive airdrops for free
Launchpad
Be early to the next big token project
Alpha Points
NEW
Trade on-chain assets and enjoy airdrop rewards!
Futures Points
NEW
Earn futures points and claim airdrop rewards
Investment
Simple Earn
Earn interests with idle tokens
Auto-Invest
Auto-invest on a regular basis
Dual Investment
Buy low and sell high to take profits from price fluctuations
Soft Staking
Earn rewards with flexible staking
Crypto Loan
0 Fees
Pledge one crypto to borrow another
Lending Center
One-stop lending hub
VIP Wealth Hub
Customized wealth management empowers your assets growth
Private Wealth Management
Customized asset management to grow your digital assets
Quant Fund
Top asset management team helps you profit without hassle
Staking
Stake cryptos to earn in PoS products
Smart Leverage
NEW
No forced liquidation before maturity, worry-free leveraged gains
GUSD Minting
Use USDT/USDC to mint GUSD for treasury-level yields
More
Trending Topics
View More1.43K Popularity
14.63K Popularity
10.35K Popularity
5.43K Popularity
92.31K Popularity
Hot Gate Fun
View More- MC:$4.26KHolders:23.08%
- MC:$3.61KHolders:20.00%
- MC:$3.64KHolders:10.00%
- MC:$3.63KHolders:10.00%
- MC:$3.94KHolders:21.44%
Pin
Gate Square New & Returning Creator Rewards are ongoing!
Your ideas may be more valuable than you think!
Make your first post or come back post to share a $20,000 monthly prize pool!
Post with #MyFirstPostOnSquare to receive a $50 Position Voucher each
Monthly Top Posters and Top Engagers will each earn an extra $50 reward
Your crypto insights could inspire many—start creating today!
👉 https://www.gate.com/postGate Square “Creator Certification Incentive Program” — Recruiting Outstanding Creators!
Join now, share quality content, and compete for over $10,000 in monthly rewards.
How to Apply:
1️⃣ Open the App → Tap [Square] at the bottom → Click your [avatar] in the top right.
2️⃣ Tap [Get Certified], submit your application, and wait for approval.
Apply Now: https://www.gate.com/questionnaire/7159
Token rewards, exclusive Gate merch, and traffic exposure await you!
Details: https://www.gate.com/announcements/article/47889Your First Words Matter!
Share your first post on and split $10,000 in New Year rewards.
Post with #My2026FirstPost to share your New Year wish
2026U Position Voucher, Gate New Year boxes, F1 Red Bull merch await you!
Ends on Jan 15, 2026, 16:00 UTC
2026 starts with this post!Gate 2025 Year-End Gala Square TOP50 List Announced!
The final ranking phase is now live.
Earn Votes by watching live streams and posting.
30 Votes = 1 chance — support your favorite creators now!
👉 https://www.gate.com/activities/community-vote-2025
iPhone 17 Pro Max, JD gift cards, Mi Band, Gate merch await you!
Creators are welcome to rally fans to climb the rankings and win rewards!
Voting ends: Jan 20, 02:00 UTC
Details: https://www.gate.com/announcements/article/48693
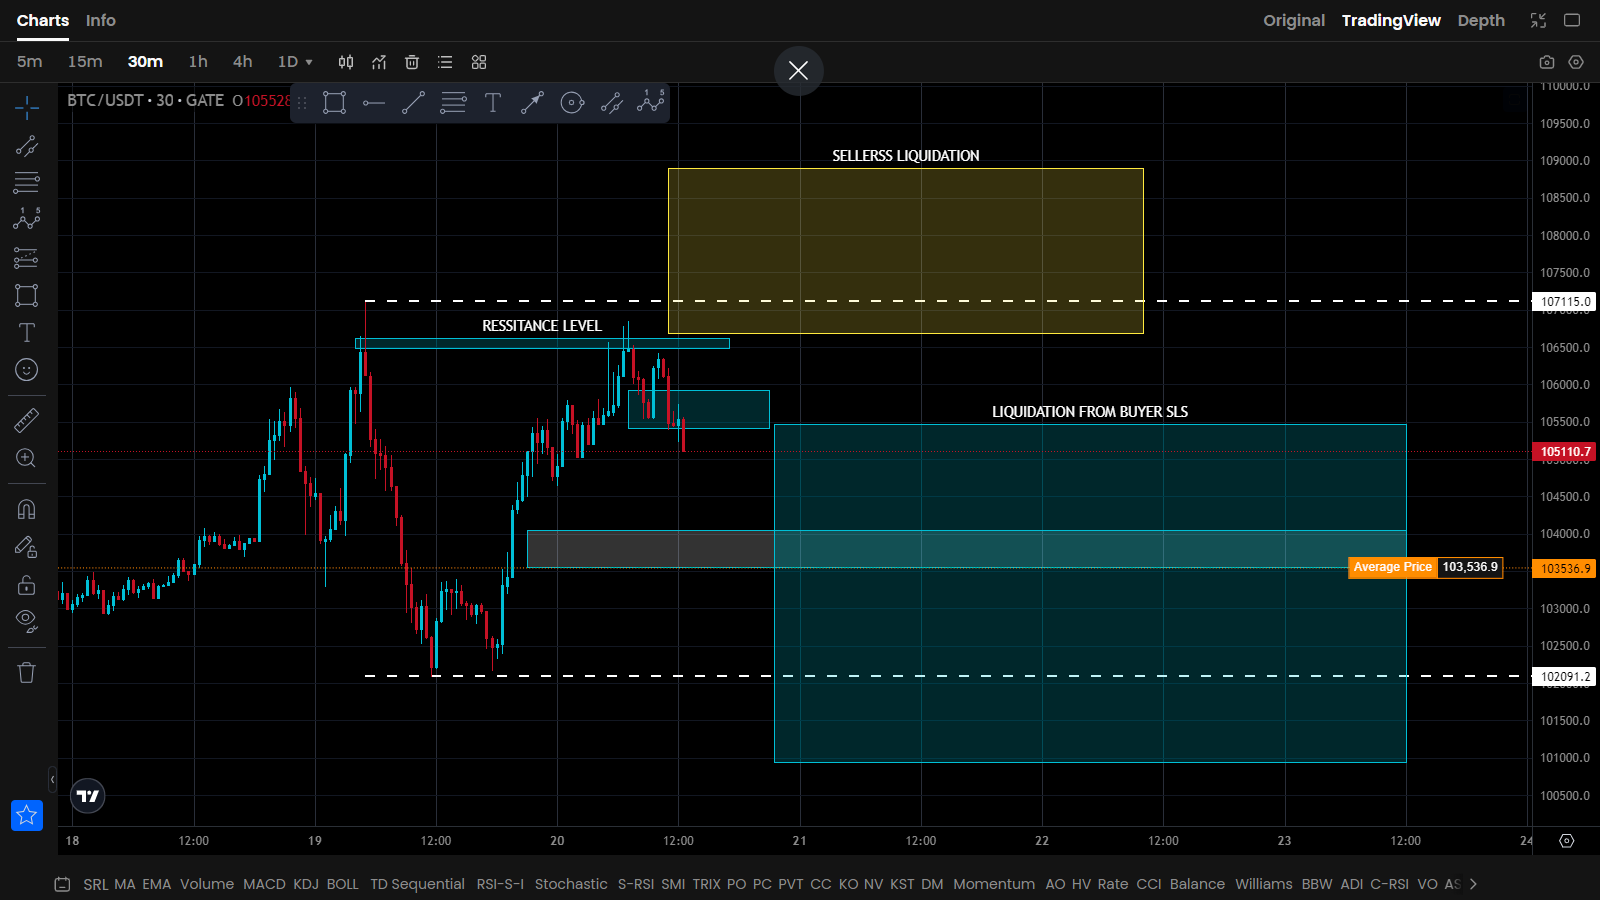
🔍 BTC/USDT Technical Analysis – Key Resistance Holding, Liquidation Zones in Play
In this BTC/USDT 30-minute chart analysis, several critical levels and zones are highlighted, reflecting the current market dynamics:
📌 Resistance Level: Price recently tested a horizontal resistance zone but failed to break through. The market rejected around the 107150 level, indicating strong selling pressure. This is also where sellers are likely placing short positions.
📌 Seller Liquidation Zone: A yellow zone above the resistance suggests a potential liquidation area for short sellers. If the price breaks above the resistance, we could see a sharp upward movement as stop-losses of short positions get triggered.
📉 Buyer Liquidation Zone: A large blue shaded area indicates potential liquidation for buyers who entered around the top. If the price continues to fall, stop-losses for long positions may activate, potentially driving the price down further.
⚠️ Current Price: BTC is hovering around $105110, slightly above the average price level ($103536.9). The market could see volatility in either direction depending on whether bulls reclaim resistance or bears push toward the lower demand zone.
🔮 Outlook: Watch for a breakout above resistance for a potential bull run targeting the seller liquidation zone. Conversely, a breakdown below $103500 could trigger buyer stop-losses, accelerating downward movement.