
**Date: **Tue, Jan 06, 2026 | 10:08 AM GMT
The broader cryptocurrency market continues to show fresh strength at the start of the new year. Both Bitcoin (BTC) and Ethereum (ETH) are posting weekly gains of over 6%, helping restore confidence across the market. This improving sentiment is now spilling over into major altcoins — including Jupiter (JUP).
JUP has already delivered an impressive 20% gain on the week. While the short-term momentum is encouraging, the more important development is unfolding on the higher-timeframe chart. Recent price action suggests a meaningful shift in market behavior, hinting that JUP could be transitioning from a corrective phase into a broader bullish continuation if key resistance zones are reclaimed.
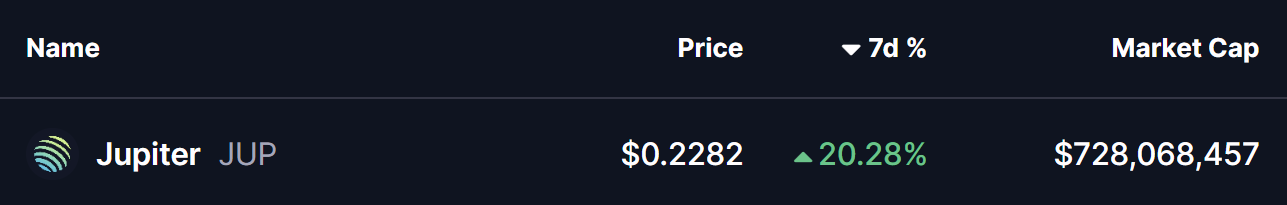
Source: Coinmarketcap
Rounding Bottom Formation Taking Shape
On the daily chart, Jupiter appears to be forming a rounding bottom pattern — a classic bullish reversal structure that typically develops after extended downside pressure and gradual seller exhaustion.
This setup began after JUP faced a strong rejection from the $0.4540–$0.4760 resistance zone in late October. That rejection triggered a sharp sell-off, dragging price lower toward the $0.17 region. However, bears failed to maintain control beyond that point. Selling pressure faded, demand began to absorb supply, and price started stabilizing.
Over time, volatility compressed and JUP began curling higher in a smooth, rounded fashion — closely matching the textbook behavior of a developing rounding bottom. Importantly, the recent recovery has pushed price back above the 50-day moving average around $0.2192, a level that previously capped upside attempts and now appears to be turning into support.
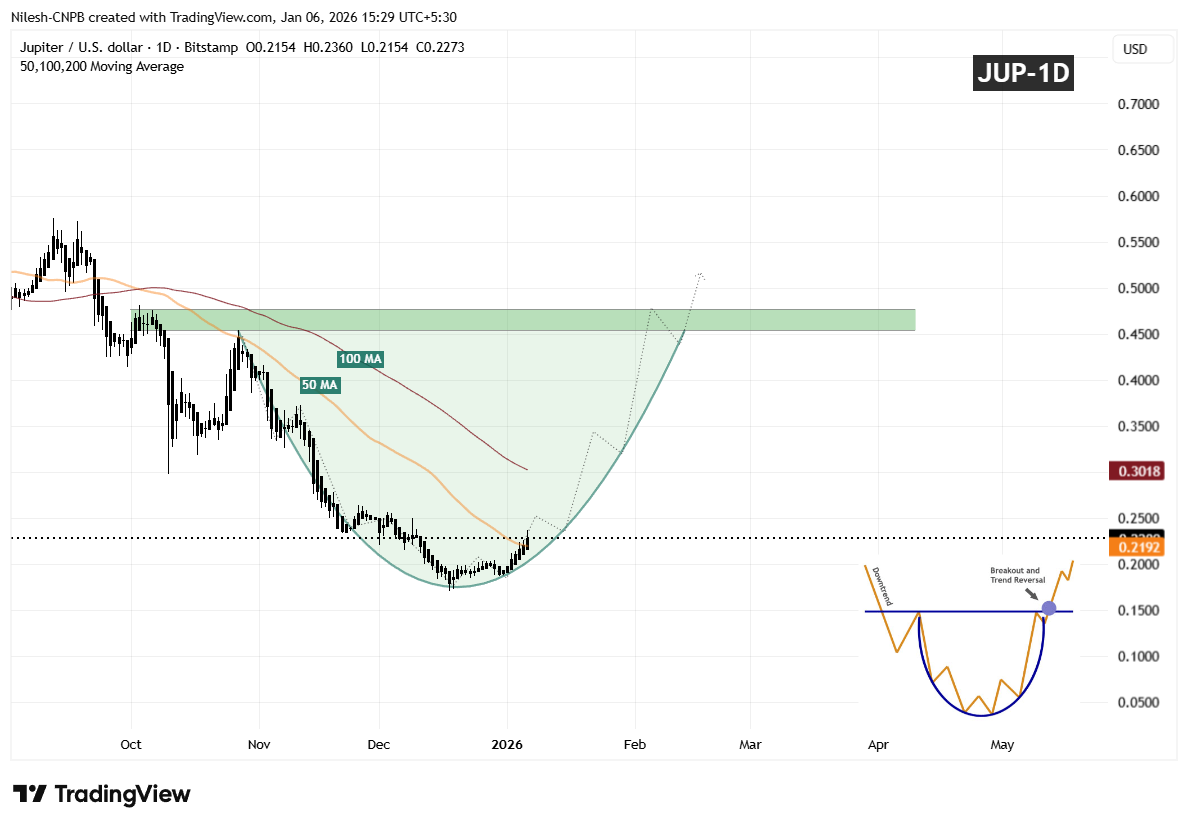
Jupiter (JUP) Daily Chart/Coinsprobe (Source: Tradingview)
The gradual slope of the recovery suggests organic accumulation rather than speculative spikes, reinforcing the credibility of the developing base.
What’s Next for JUP?
If JUP continues to hold above the 50-day moving average, this level could serve as a solid foundation for further upside, with the 100-day moving average acting as the next upside magnet in the near term.
A clean and decisive breakout above the $0.4540–$0.4760 resistance zone, followed by sustained acceptance above that area, would confirm the rounding bottom reversal and likely open the door for a broader bullish expansion phase.
Until that breakout occurs, the pattern remains in development. Some short-term consolidation or shallow pullbacks are possible as price digests recent gains. However, as long as JUP continues to print higher lows above the established base, the broader structure remains constructive.
For now, the chart suggests Jupiter is approaching a critical confirmation phase — one that could determine whether this recovery matures into a sustained bullish trend as 2026 progresses.
Disclaimer: The views and analysis presented in this article are for informational purposes only and reflect the author’s perspective, not financial advice. Technical patterns and indicators discussed are subject to market volatility and may or may not yield the anticipated results. Investors are advised to exercise caution, conduct independent research, and make decisions aligned with their individual risk tolerance.
About Author: Nilesh Hembade is the Founder and Lead Author of Coinsprobe, with over 5 years of experience in the cryptocurrency and blockchain industry. Since launching Coinsprobe in 2023, he has been providing daily, research-driven insights through in-depth market analysis, on-chain data, and technical research.
Disclaimer: The information on this page may come from third parties and does not represent the views or opinions of Gate. The content displayed on this page is for reference only and does not constitute any financial, investment, or legal advice. Gate does not guarantee the accuracy or completeness of the information and shall not be liable for any losses arising from the use of this information. Virtual asset investments carry high risks and are subject to significant price volatility. You may lose all of your invested principal. Please fully understand the relevant risks and make prudent decisions based on your own financial situation and risk tolerance. For details, please refer to
Disclaimer.
Related Articles
Today, the cryptocurrency Fear and Greed Index is at 12, indicating the market is in extreme fear.
Gate News Report, March 8th, according to Alternative.me data, today’s cryptocurrency Fear and Greed Index is at 12, indicating the market is in a "Extreme Fear" state. This index measures market sentiment, with lower values indicating higher levels of fear.
GateNews9m ago
CryptoQuant Analyst: Bitcoin NUPL-MVRV indicator reaches 0.33, indicating that extreme selling conditions are moderating
Gate News Announcement, March 8 — CryptoQuant analyst Axel posted on X platform that Bitcoin may have entered the mid-stage of this bear market cycle. Data shows that the NUPL–MVRV harmonic composite indicator has reached 0.33, while historical cycle bottoms typically occur around the -0.5 level. The chart indicates that the start of the bear market cycle is trending upward, suggesting that extreme selling conditions are moderating. However, the indicator remains well above historical bottom levels, indicating that a full-scale market sell-off has not yet been confirmed.
GateNews48m ago
Polkadot to Reset Tokenomics on March 12 With Major DOT Supply and Staking Changes
Polkadot will introduce a new monetary framework on March 12 that sets DOT’s supply cap at 2.1 billion and lowers emissions by 53.6%.
The overhaul will also create a Dynamic Allocation Pool and shorten the DOT unbonding period from 28 days to 24–48 hours.
On March 12, Polkadot will reset
CryptoNewsFlash4h ago
Bitcoin May Be Closer to a Bottom Than Most Think, Chart Signals
The Bitcoin price slipped about 2% today, trading slightly below $68,000 after pushing above $73,000 earlier this week, as already covered on our site. The move added fresh pressure to a market that still feels shaky, especially after several failed attempts to hold higher levels.
Still, not e
CaptainAltcoin5h ago
Dogecoin Monthly Breakdown Pattern Reappears as Price Tests $0.0918
Dogecoin is currently trading at $0.09205 at a gain of 2.3, with support of above $0.08878.
As can be seen in the monthly chart, there are recurring breakdown areas that have been followed by significant expansions in price.
The short-term trading range is narrow and the immediate point o
CryptoNewsLand5h ago
Solana Eyes $90.6 Trigger Point as $83 Support Holds and Liquidation Pressure Builds
A large cluster of short positions faces liquidation if SOL reaches $90.6, potentially increasing volatility.
SOL trades between $83.00 support and $89.58 resistance, keeping price action compressed in the short term.
SOL posts a 0.8% daily gain and rises 0.7% against BTC, holding
CryptoNewsLand5h ago