Is the SOL Bull Market Over? Three Things to Consider Today (Solana Price Analysis)
Solana’s spectacular performance has come to an end – or at least that’s how the market looks at the time of this writing.
Key Support levels: $44
Key Resistance levels: $67
1. Uptrend Lost?
Despite a good show from buyers, Solana lost momentum once the price reached the resistance at $67, where it was rejected by sellers. Bears have taken over, and the uptrend that started in mid-October has seemingly come to an end.
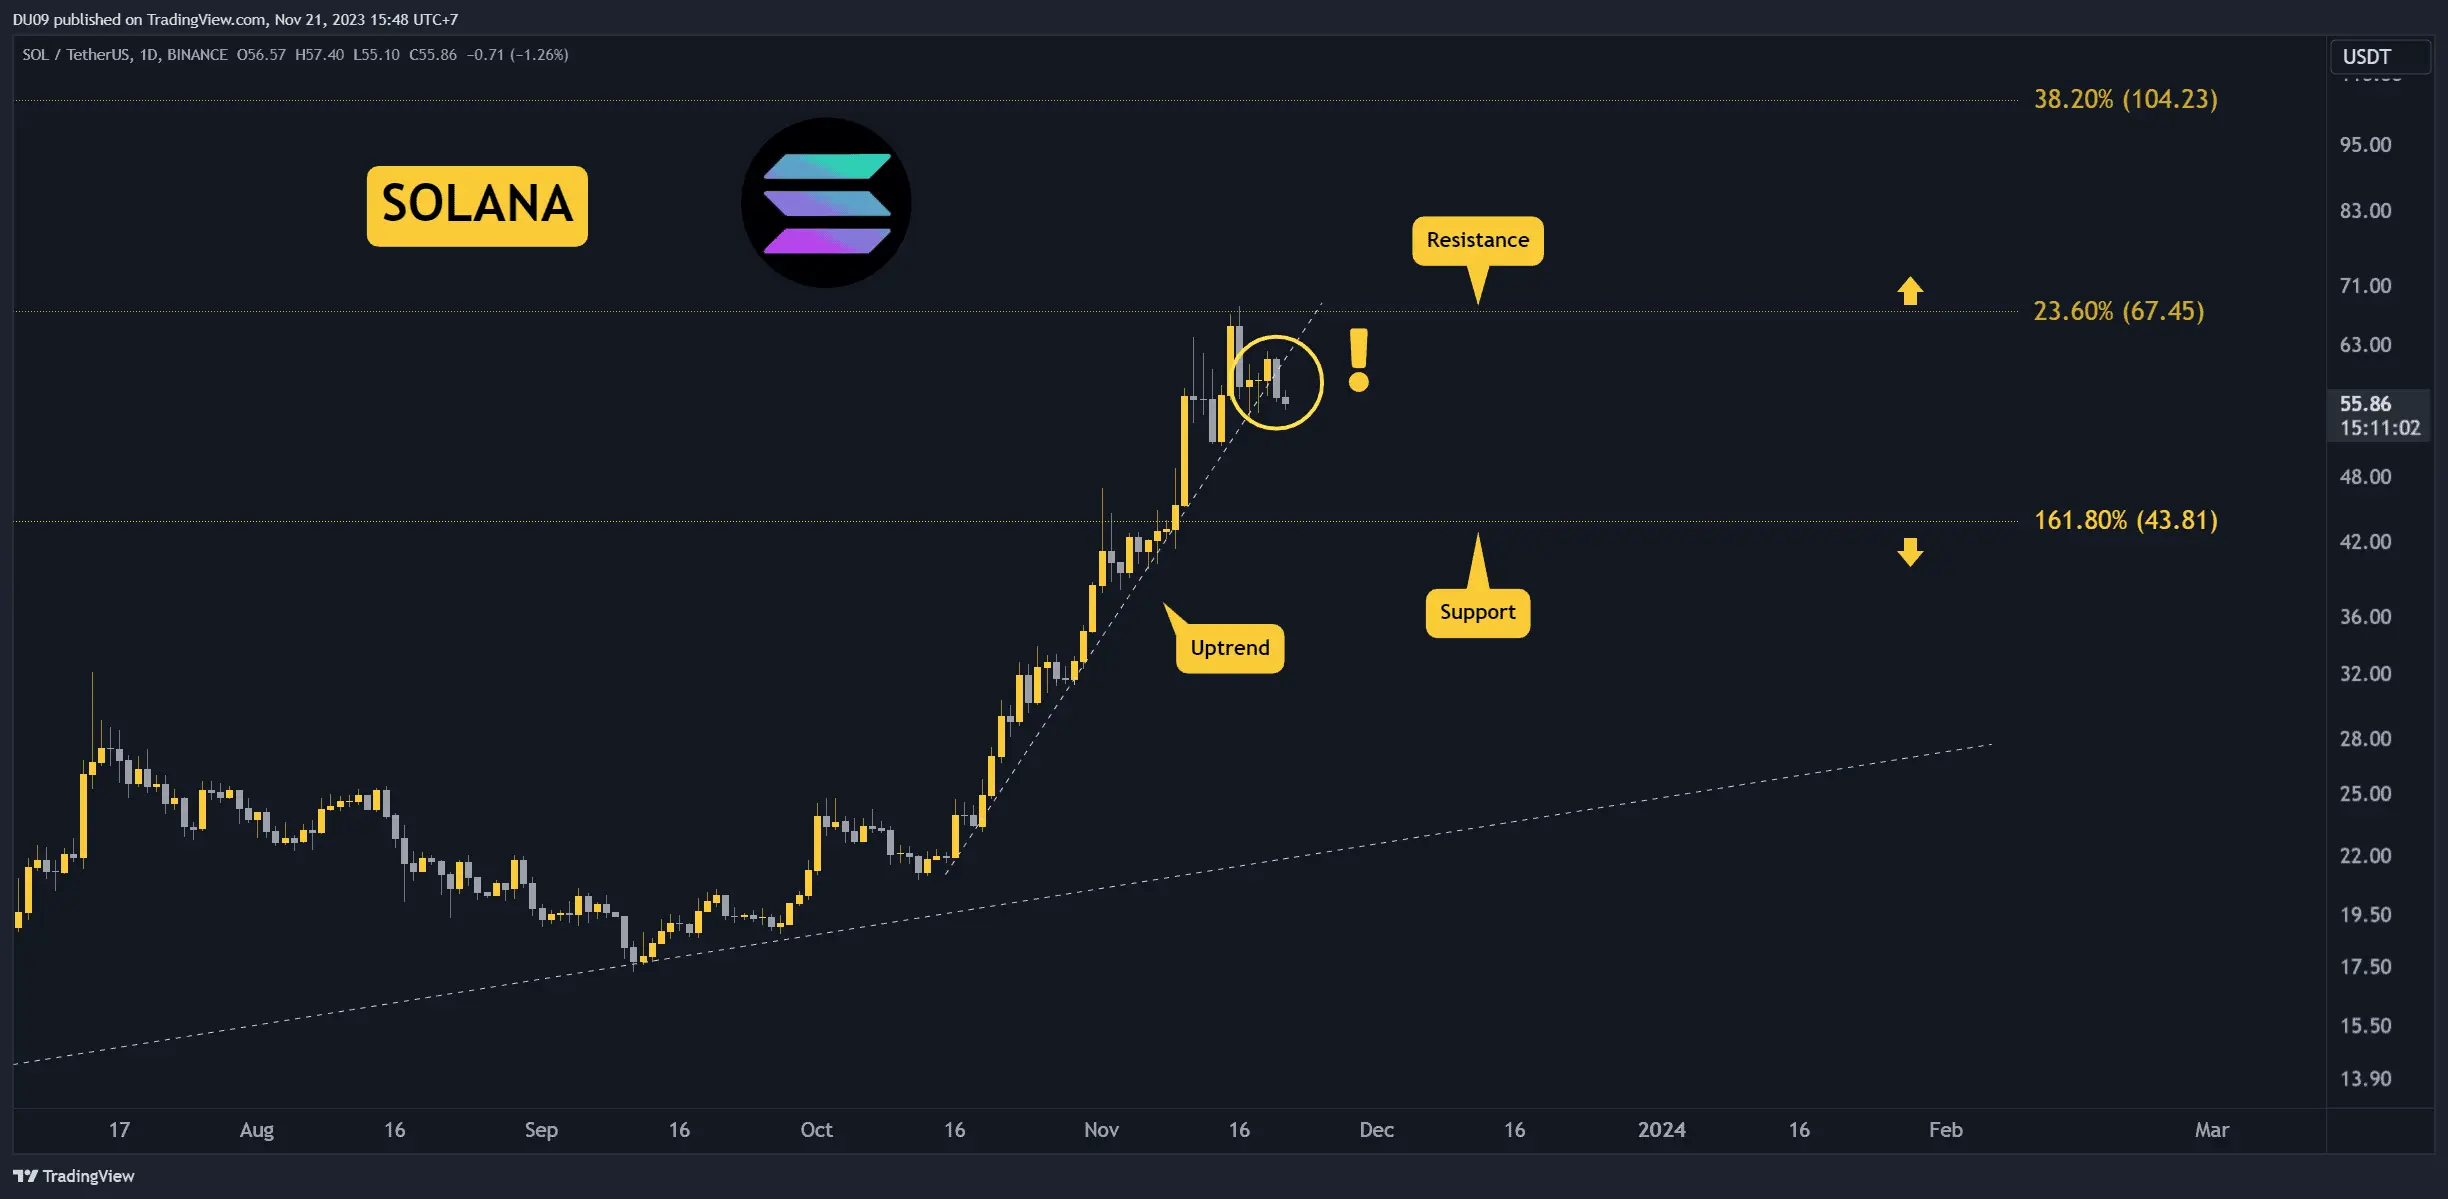 Chart by TradingView## 2. Bearish Cross on Daily
The daily MACD moving averages just did a bearish cross today, which confirms that sellers are back. If buyers don’t return, then this correction could see Solana fall back to its current support at $44.
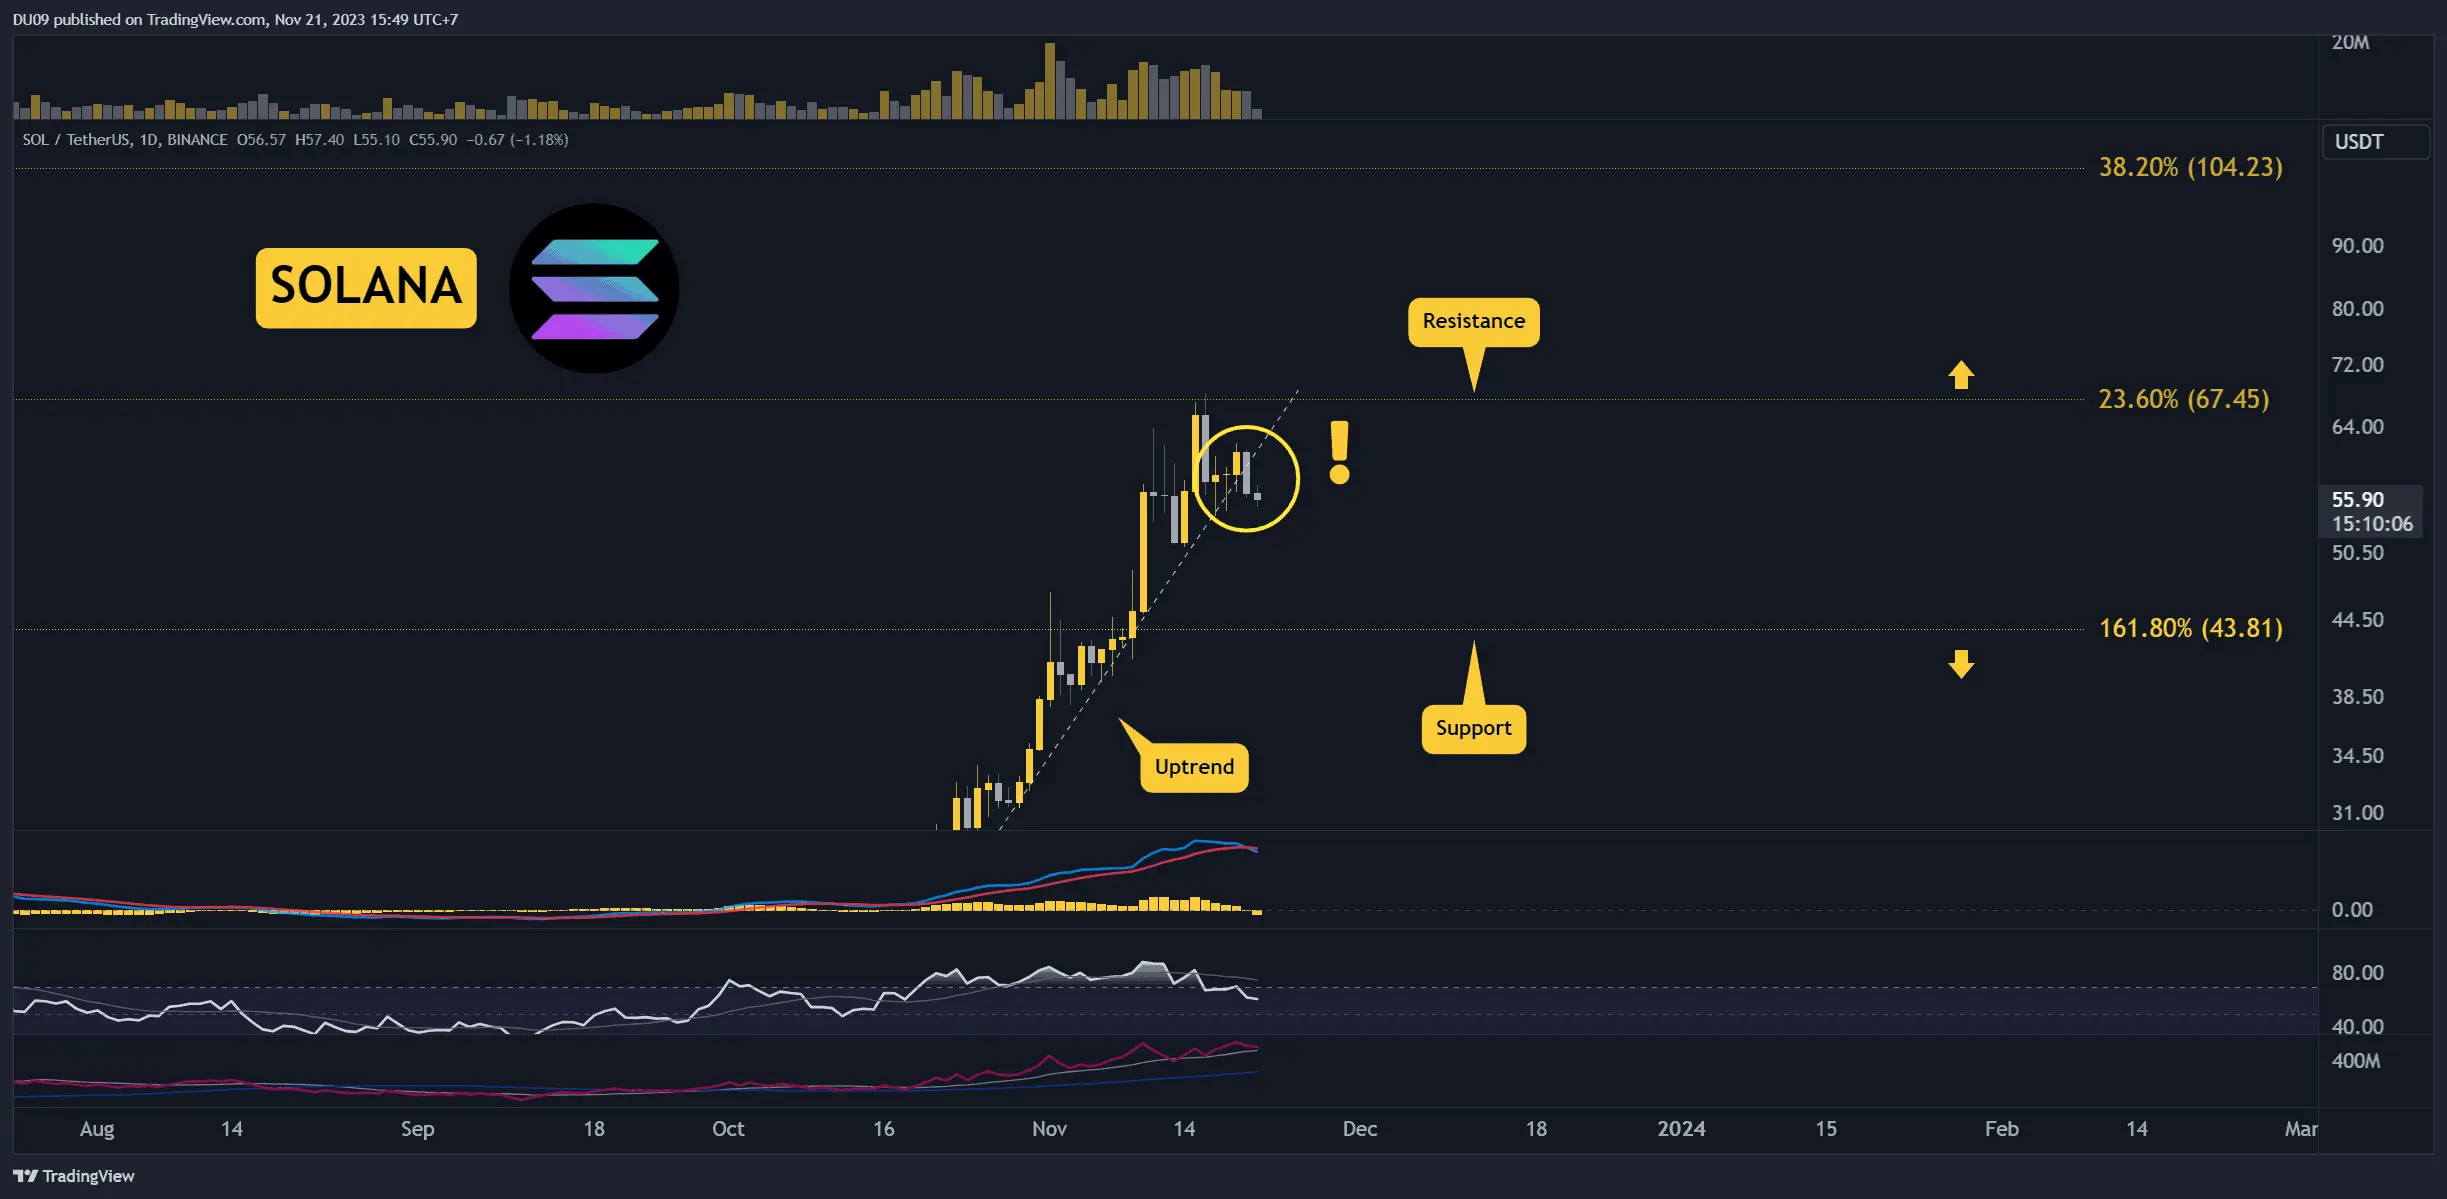 Chart by TradingView## 3. Daily RSI Bearish Divergence
The bearish divergence that was spotted last week has been confirmed. The price failed to make higher highs and is now found in a correction. Until the daily RSI makes higher highs, the bias remains bearish.
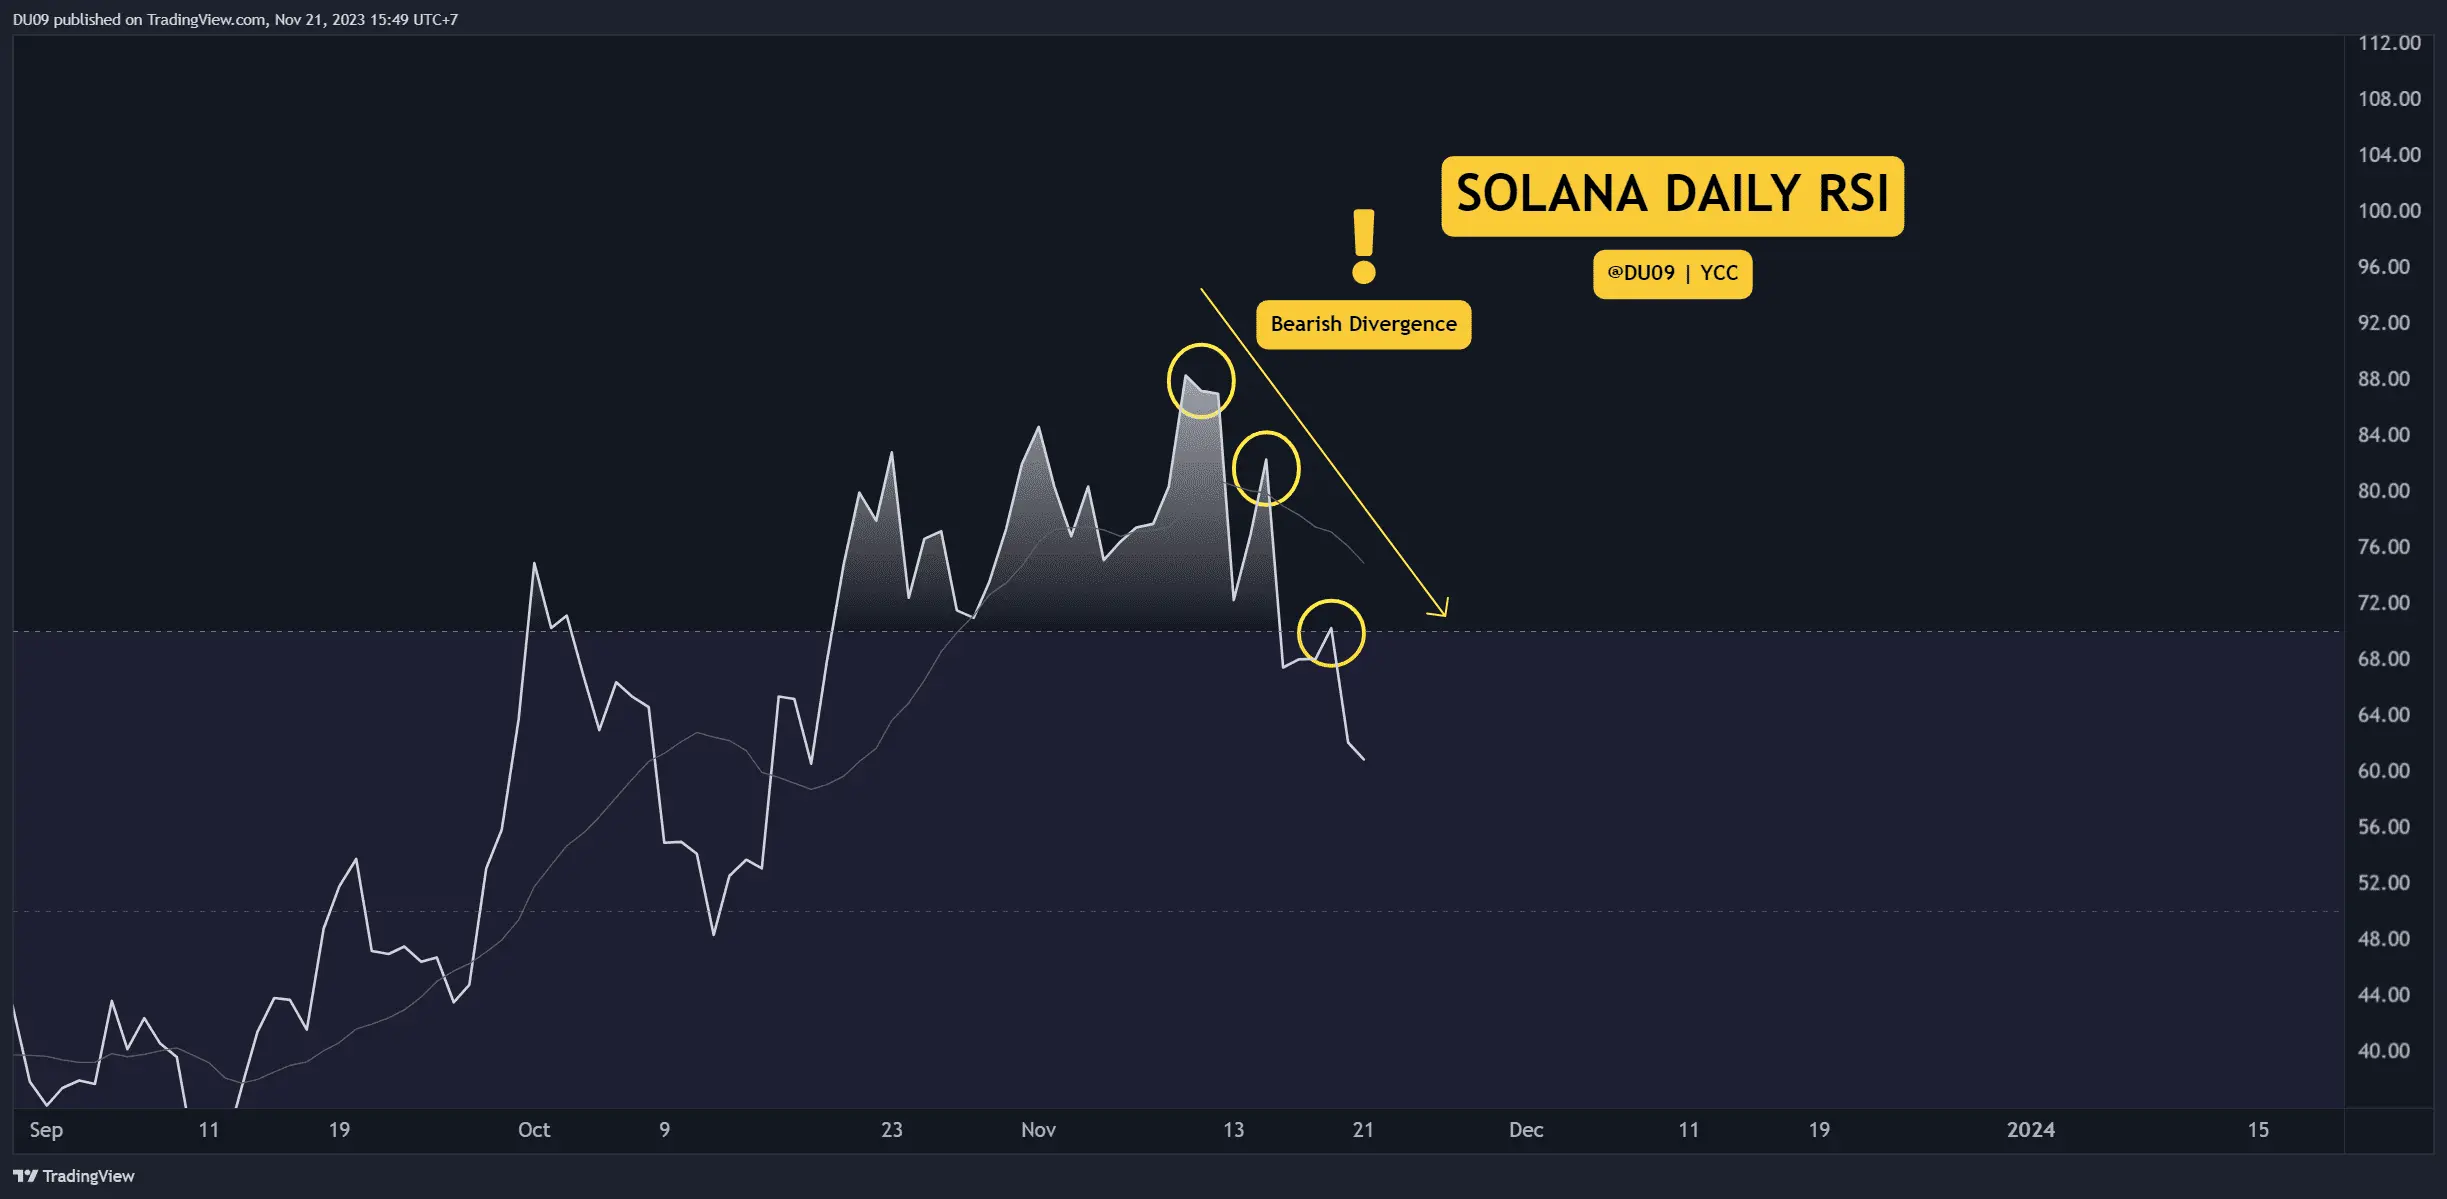 Chart by TradingView## Bias
The bias for SOL is bearish.
Short-Term Prediction for SOL Price
With the uptrend lost, Solana is in search of support. The level at $44 is a strong candidate for that as it has a good chance to attract buyers again. Once support is found, this cryptocurrency could move higher again.