Two Probable Scenarios for Bitcoin in the Coming Days: BTC Price Analysis
CryptoPotato
Bitcoin’s price has expanded considerably throughout the past week, charting an increase of around 15%.
We take a look at some of the important technical levels and whether or not the rally has any future potential.
Technical Analysis
By Shayan
Recently, Bitcoin made a decisive breakout above the crucial 100 and 200-day moving averages and surpassed its yearly high at $32K, reinstating bullish sentiment in the market. Currently, Bitcoin faces a significant resistance region, suggesting the possibility of a temporary correction.
The Daily Chart
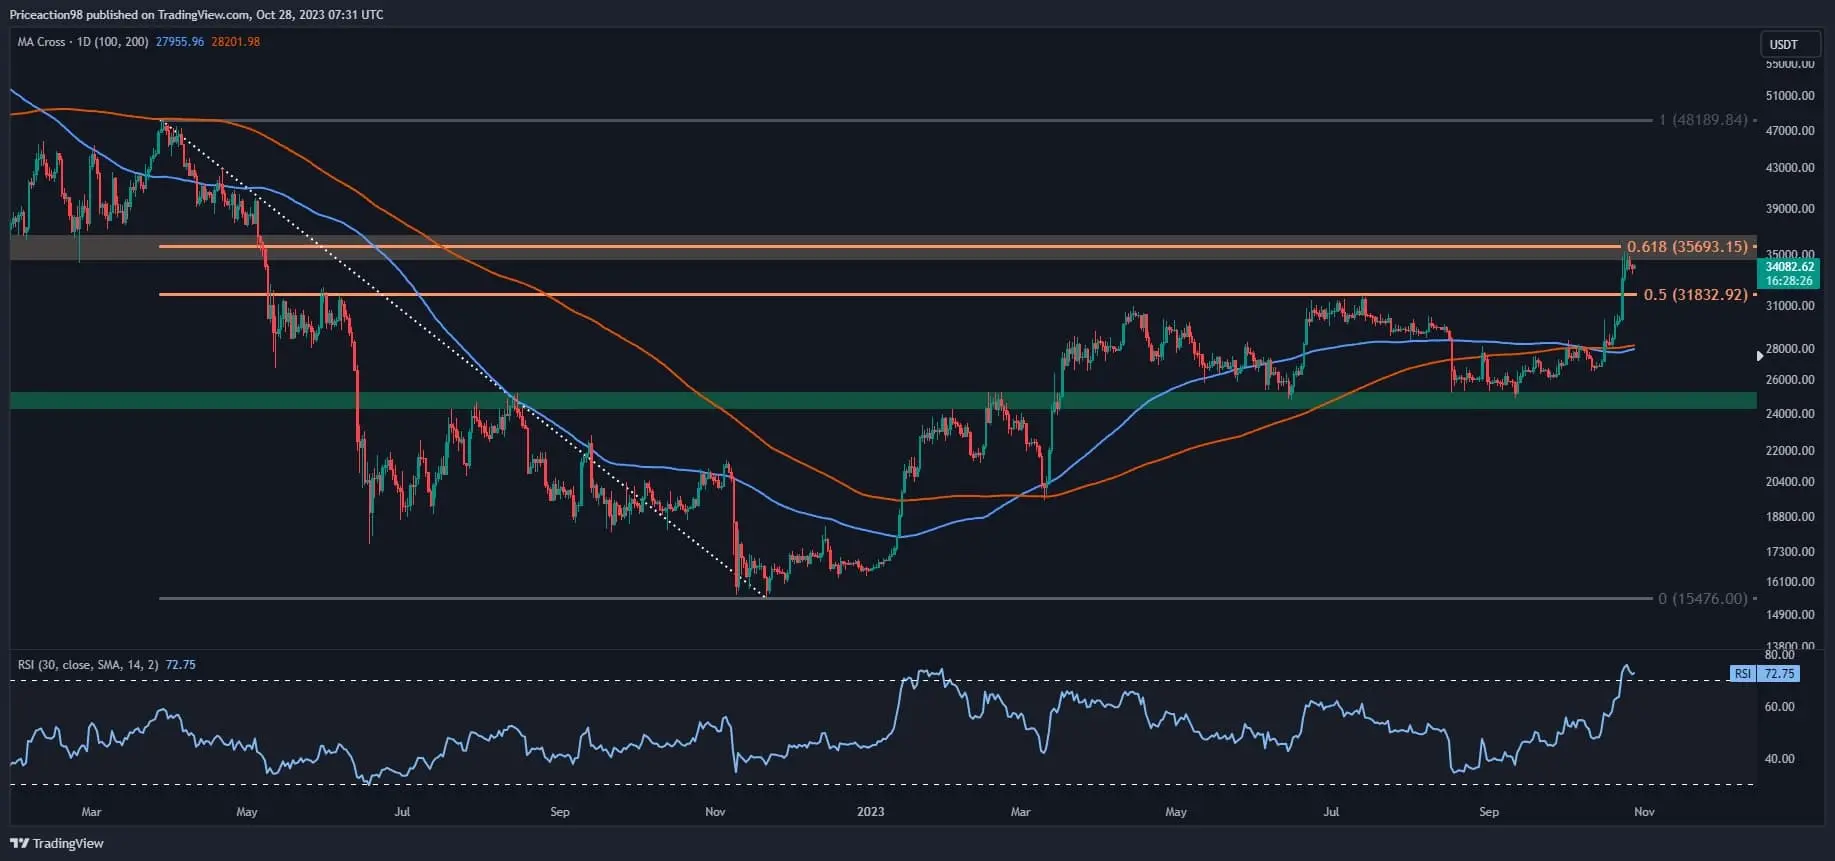
Analyzing the daily chart, Bitcoin displayed a noteworthy upward move following its breakthrough above the critical resistance at $27K, which was indicated by the convergence of the 100 and 200-day moving averages.
The impressive surge continued, ultimately breaching the $32K resistance, a price point that aligns with Bitcoin’s peak in 2023. Subsequently, market participants drove Bitcoin’s value closer to a significant resistance region at $35K, distinguished by the 0.5 and 0.618 Fibonacci levels, establishing a new yearly high.
In the event that buyers effectively secure this pivotal level, it has the potential to pave the way for an optimistic mid-term trend, with higher resistance zones as possible targets. Conversely, should there be a setback or rejection, Bitcoin could potentially enter a phase of consolidation correction characterized by heightened market volatility.
 Source: TradingView# The 4-Hour Chart
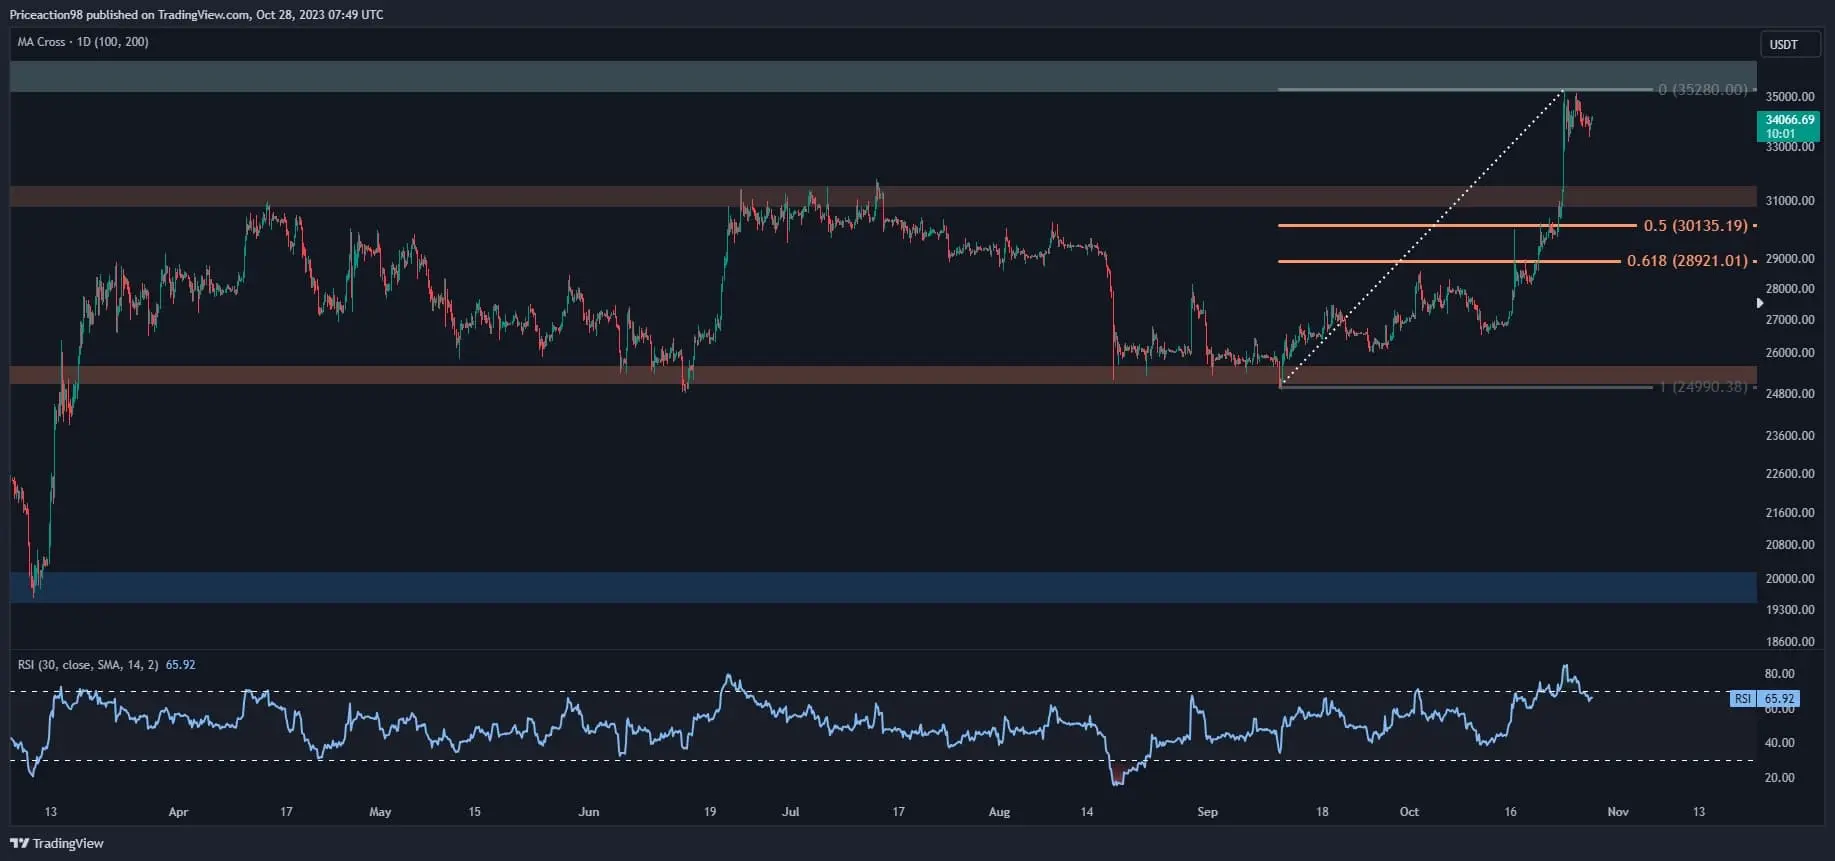
On the 4-hour chart, Bitcoin’s price experienced an extended period of consolidation, fluctuating in the range between the $25K and $32K levels. Subsequently, there was a solid upward momentum that propelled the price beyond the upper threshold of the range, establishing a new yearly peak at $35K.
However, the price currently encounters significant resistance at $35K, marked by substantial Bitcoin supply. This resistance could temporarily slow down the upward trend and potentially trigger a corrective phase. In this scenario, the following support levels for Bitcoin would be within the price range corresponding to the 0.5 and 0.618 Fibonacci retracement levels.
Nevertheless, if buyers unexpectedly manage to overpower the sellers, a sudden breakout is possible, leading to a robust price surge. Regardless of the outcome, it is crucial to closely observe the price movements in the coming days, as the market might experience increased volatility.
 Source: TradingView# On-chain Analysis
By Shayan
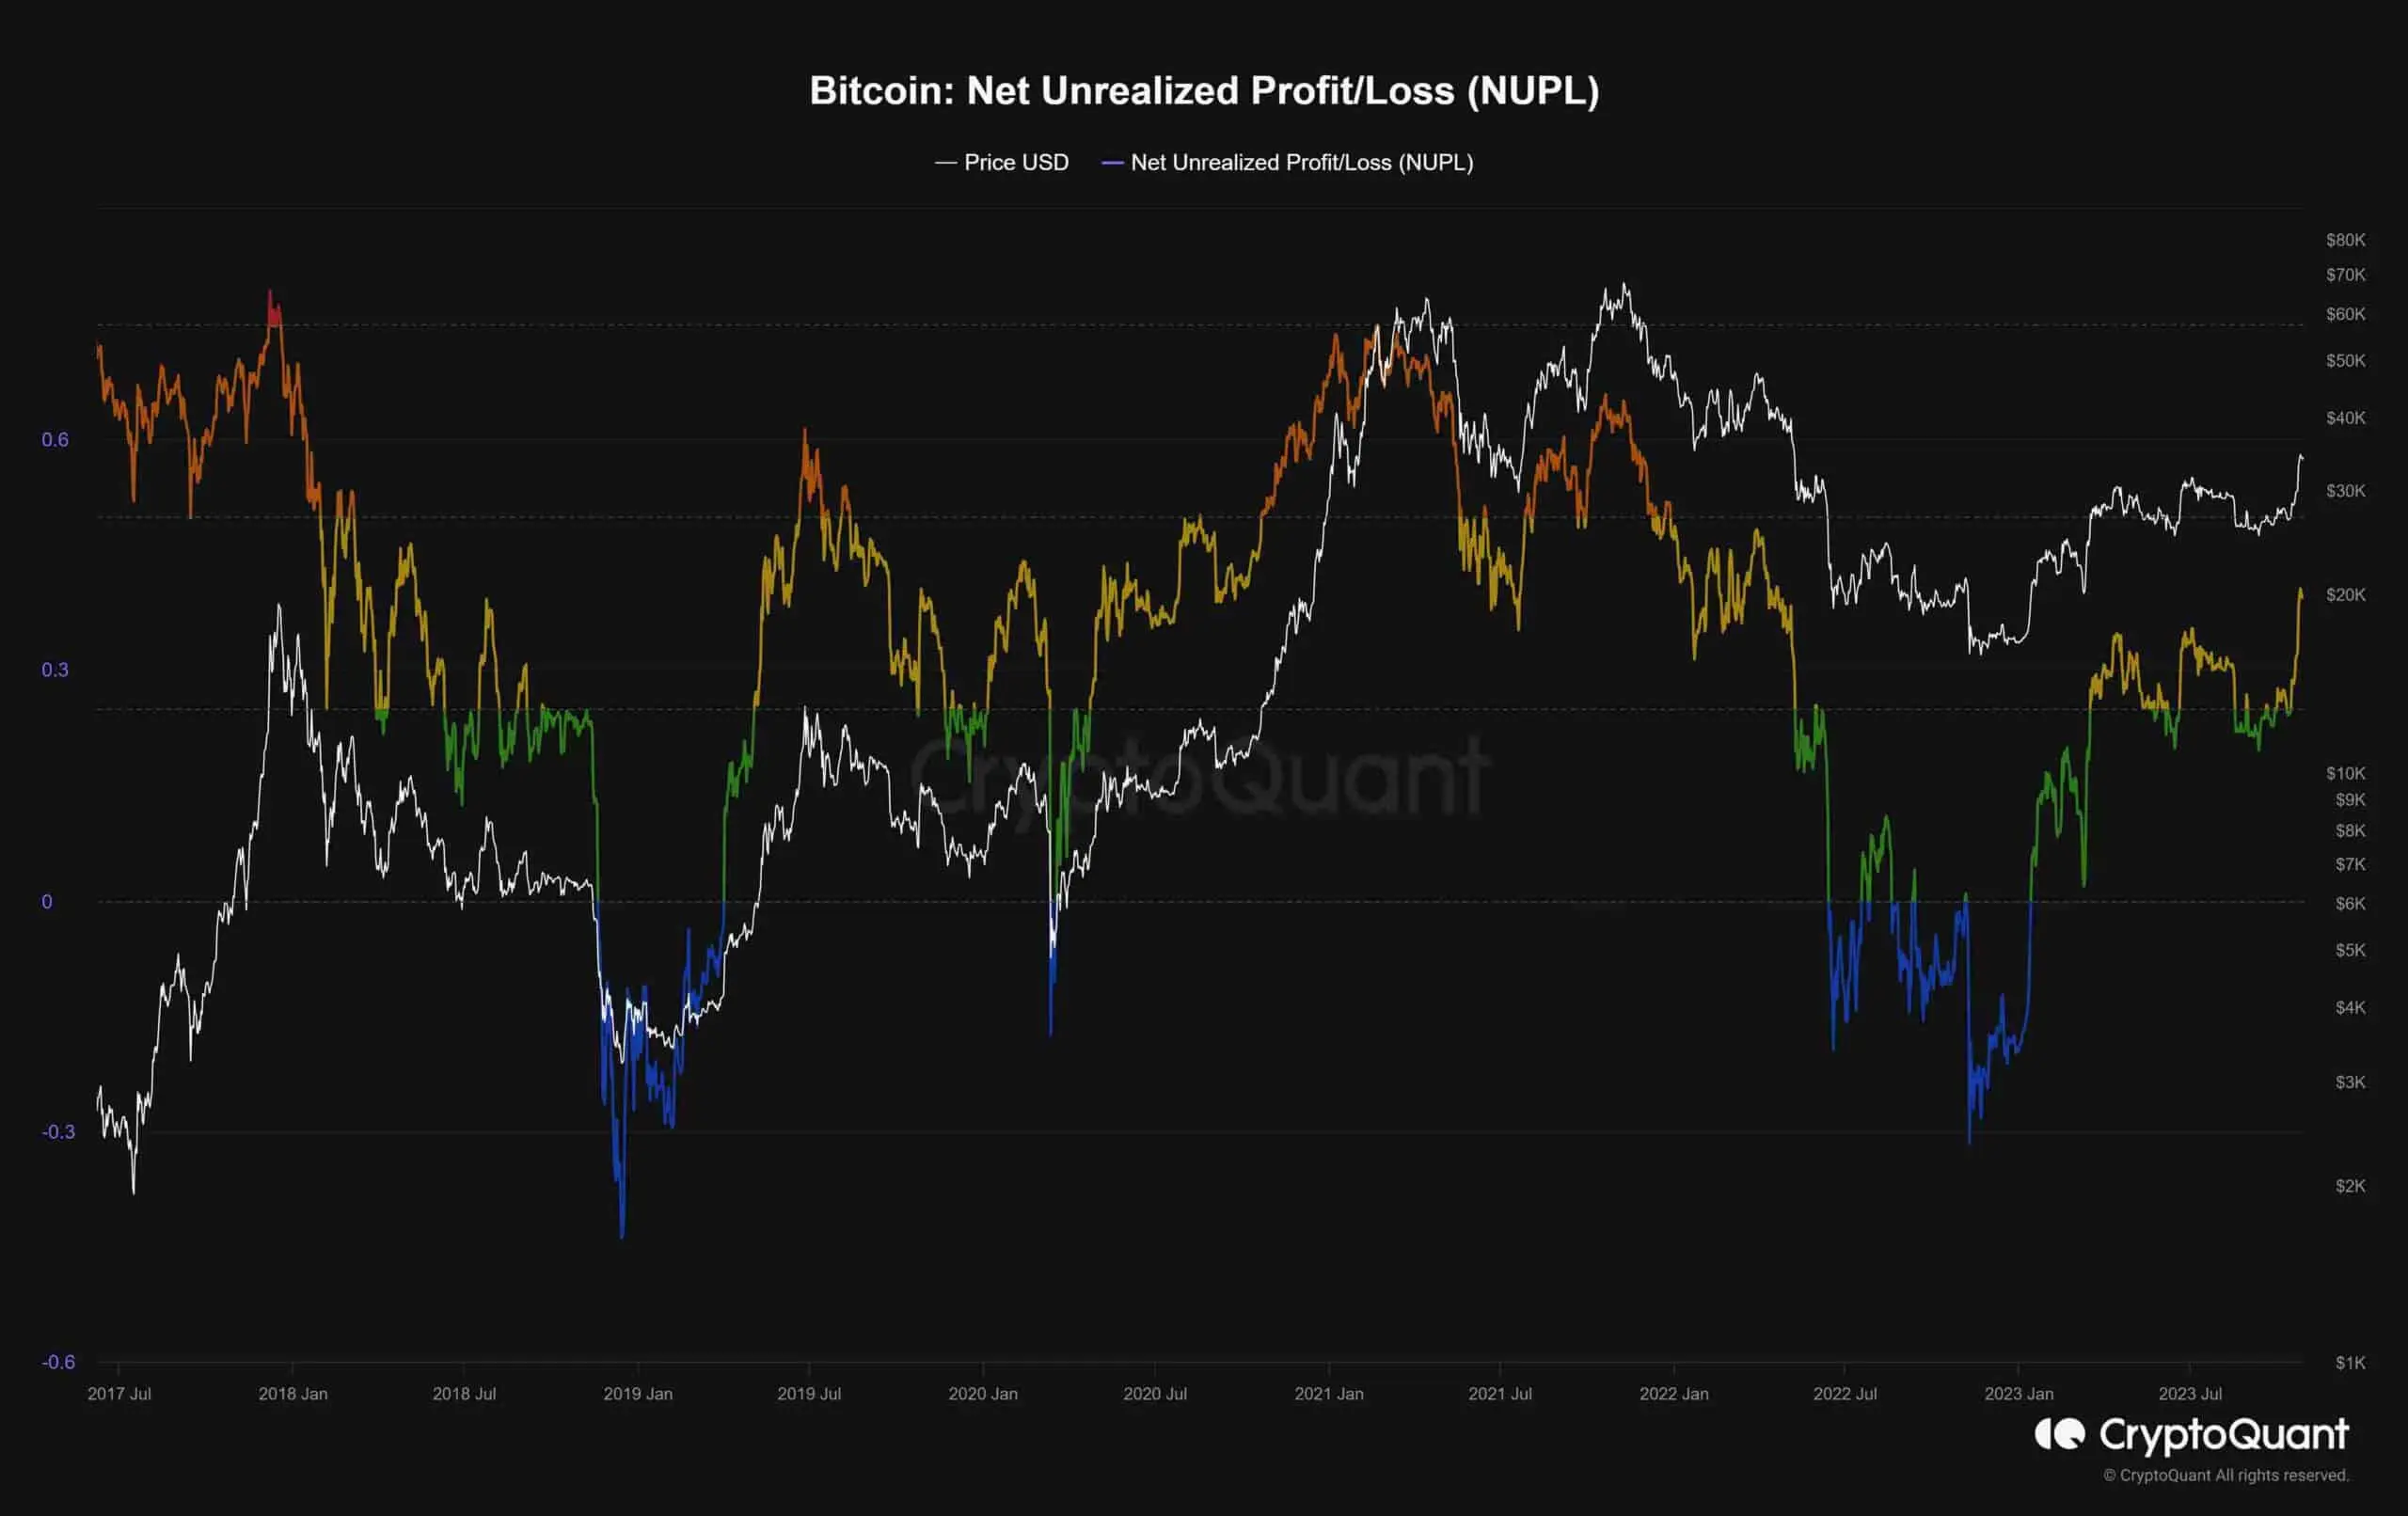
Bitcoin has been consistently on an upward trajectory since the beginning of 2023, exhibiting a general uptrend. Most recently, following a consolidation phase within the range of $25K to $31K, the price reached a new yearly high at $34K, instilling optimism among market participants.
The NUPL (Net Unrealized Profit/Loss) metric, displayed on the chart, serves as a crucial indicator, as it acts as a gauge, indicating the proportion of investors currently in a profitable position.
Recent movements in the NUPL metric are noteworthy. Following a notable uptrend, the metric is currently approaching the 0.5 level, denoted as the Belief-Denial Phase (Orange), indicating that a larger group of investors is presently enjoying profitable returns.
This signals a prent optimistic sentiment in the market. However, it’s essential to note that despite the existing bullish sentiment, the eventual realization of these profits might introduce short-term volatility to the market.
 Source: CryptoQuant
免責事項:このページの情報は第三者から提供される場合があり、Gateの見解または意見を代表するものではありません。このページに表示される内容は参考情報のみであり、いかなる金融、投資、または法律上の助言を構成するものではありません。Gateは情報の正確性または完全性を保証せず、当該情報の利用に起因するいかなる損失についても責任を負いません。仮想資産への投資は高いリスクを伴い、大きな価格変動の影響を受けます。投資元本の全額を失う可能性があります。関連するリスクを十分に理解したうえで、ご自身の財務状況およびリスク許容度に基づき慎重に判断してください。詳細は免責事項をご参照ください。
コメント
0/400
コメントなし