XRP Price Manipulation? Trader Spots Same Pattern Every US Session
XRP has been frustrating bulls for months. Despite a steady stream of positive news from Ripple, including ETF exposure, acquisitions, licenses, and institutional adoption, the XRP price sits 44% below its highs. Something feels off to traders watching the charts, and one analyst believes he has identified exactly what is happening.
XRP analyst Arthur shared a detailed observation that has resonated with many in the community. His claim is direct. XRP is being systematically manipulated. The pattern repeats over and over. The price pumps straight to key resistance, then the U.S market opens, and the XRP price dumps. He asks whether this is the “new Jane Street playbook” and urges the XRP Army to wake up.
- The XRP Chart Tells the Story
- The Fundamental Disconnect
- Key XRP Levels to Watch
- What This Means for XRP Holders
The XRP Chart Tells the Story
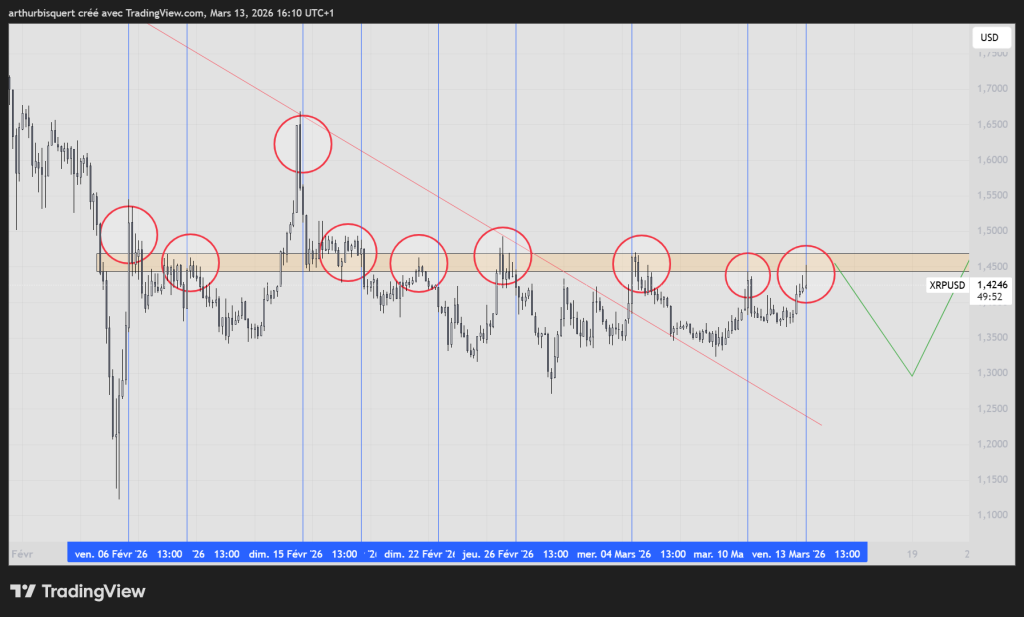
Looking at the chart shared by Arthur, the pattern becomes visible. While XRP has been building a pattern of higher highs and higher lows since February’s lows, every attempt to rise above resistance is met with selling pressure as the U.S markets open.
The chart shows the XRP price climbing toward the $1.50–$1.55 zone multiple times. Each time, as the price approaches this resistance, it gets rejected and pulled back lower. The timing, according to Arthur, correlates with the US market open. The pattern repeats with enough regularity that it looks intentional rather than organic.
Source: X/@XrpArthur
The current XRP price sits near $1.4246, having pulled back from the most recent resistance test. The chart shows the clean structure of these moves, with price coiling upward during certain sessions only to get capped when US liquidity enters the market.
The Fundamental Disconnect
What makes Arthur’s observation compelling is the backdrop of positive news. Ripple has been on a tear with announcements. ETF exposure is expanding.
Acquisitions are being finalized. Licenses are being secured across multiple jurisdictions. Institutional adoption continues growing. Yet the XRP price refuses to break out in a way that reflects this progress.
This disconnect between news and price is exactly what traders point to when they suspect manipulation. In a normal market, sustained positive developments eventually push the price higher as buyers absorb available supply. Here, each rally attempt gets sold into, and the selling consistently appears during US trading hours.
Arthur’s reference to Jane Street, a major liquidity provider and trading firm, indicates that institutional players may be capping the XRP price for their own purposes. Whether this is accumulation, options positioning, or something else remains speculation. But the pattern itself is visible on the chart.
Chinese DeepSeek AI Predicts the Price of XRP and Pi Coin if the U.S. and Iran Agree to a Ceasefire_**
Key XRP Levels to Watch
The chart shows clear levels where this manipulation pattern has played out. Resistance sits in the $1.50–$1.55 zone, an area where the XRP price has been rejected multiple times. Above that, the $1.60–$1.65 region represents the next hurdle, with the recent highs near $1.73 standing as the ultimate test of whether this pattern can be broken.
Support below sits near $1.35, with stronger support at the $1.30 zone and the February lows near $1.25. A break below these levels would confirm that sellers remain in control and that the pattern is continuing.
The XRP price holding above $1.40 is the immediate test. A sustained move above resistance during U.S trading hours would be the first sign that the pattern may be breaking.
What This Means for XRP Holders
Arthur’s message is clear. The XRP price action is not reflecting the fundamental reality of Ripple’s progress. Something is capping the upside, and it appears consistently during U.S market hours. Whether this is manipulation, hedging, or simply large players positioning themselves, the pattern exists.
For traders, this means watching the timing of moves becomes as important as the levels themselves. A rally that holds through the U.S open would be significant. A rejection at the same old resistance levels would confirm the pattern continues.
For long-term holders, Arthur’s observation offers both frustration and hope. The frustration comes from watching the price get suppressed despite good news. The hope comes from knowing that if the manipulation ever stops, the XRP price could move quickly to reflect the fundamentals that have been building beneath the surface.
The XRP price sits at a critical juncture. The pattern is clear. The question is whether it breaks or continues.
関連記事