Trade
Trading Type
Spot
Trade crypto freely
Alpha
Points
Get promising tokens in streamlined on-chain trading
Pre-Market
Trade new tokens before they are officially listed
Margin
Magnify your profit with leverage
Convert & Block Trading
0 Fees
Trade any size with no fees and no slippage
Leveraged Tokens
Get exposure to leveraged positions simply
Futures
Futures
Hundreds of contracts settled in USDT or BTC
Options
HOT
Trade European-style vanilla options
Unified Account
Maximize your capital efficiency
Demo Trading
Futures Kickoff
Get prepared for your futures trading
Futures Events
Participate in events to win generous rewards
Demo Trading
Use virtual funds to experience risk-free trading
Earn
Launch
CandyDrop
Collect candies to earn airdrops
Launchpool
Quick staking, earn potential new tokens
HODLer Airdrop
Hold GT and get massive airdrops for free
Launchpad
Be early to the next big token project
Alpha Points
NEW
Trade on-chain assets and enjoy airdrop rewards!
Futures Points
NEW
Earn futures points and claim airdrop rewards
Investment
Simple Earn
Earn interests with idle tokens
Auto-Invest
Auto-invest on a regular basis
Dual Investment
Buy low and sell high to take profits from price fluctuations
Soft Staking
Earn rewards with flexible staking
Crypto Loan
0 Fees
Pledge one crypto to borrow another
Lending Center
One-Stop Lending Hub
VIP Wealth Hub
Customized wealth management empowers your assets growth
Private Wealth Management
Customized asset management to grow your digital assets
Quant Fund
Top asset management team helps you profit without hassle
Staking
Stake cryptos to earn in PoS products
BTC Staking
HOT
Stake BTC and earn 10% APR
GUSD Minting
Use USDT/USDC to mint GUSD for treasury-level yields
More


SakuraCherry
No content yet
SakuraCherry
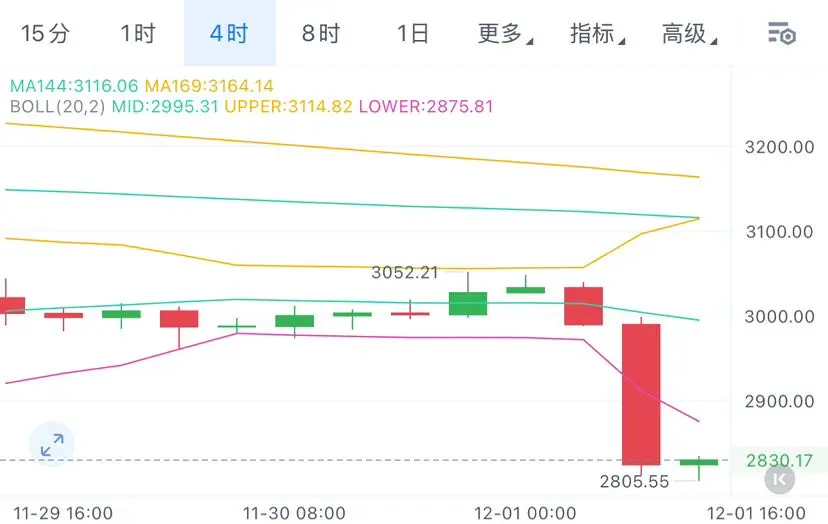
$ETH 12.1 midday ETH analysis
Current price 2830, after four consecutive bearish hours, the downward momentum weakens, which is not a signal of stopping the decline, but a weak rebound due to temporary selling pressure; the daily chart shows a long upper shadow line + an entity breaking the trend channel, which has clearly indicated high point pressure. Coupled with the current tightening of regulations + the market liquidity drying up, the overall weak structure is difficult to reverse, and the rebound remains a core opportunity for shorting.
Trading suggestion: Short near 2870-3020, target:
ETH-1.34%
- Reward
- like
- Comment
- Repost
- Share
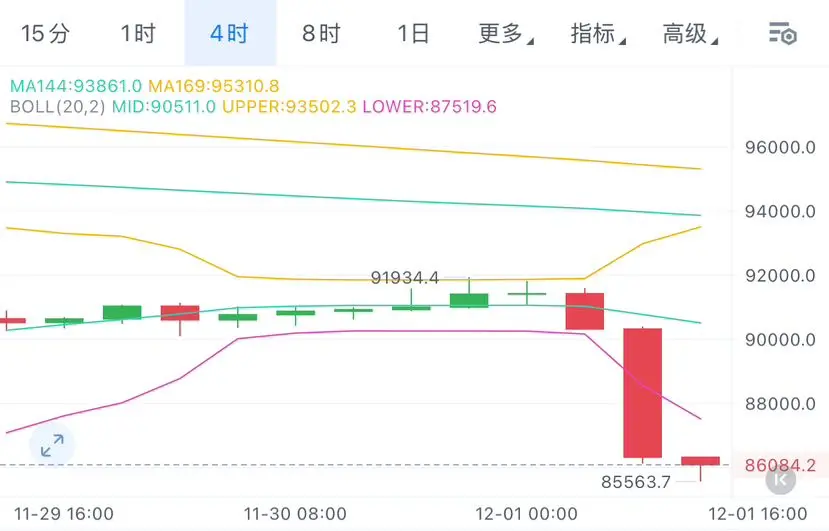
$BTC 12.1 midday BTC analysis
The current price is 86084, and the sharp decline in the morning session without a rebound is the result of the resonance of multiple negative factors: China's regulatory upgrade + the cooling of expectations for a Federal Reserve rate cut + the destruction of the bullish structure at the monthly level, compounded by a significant bearish candle breaking key support on the 4-hour chart. The current price is approaching the 83000 level, which is not a short-term fluctuation but a continuation of a trend decline. The probability of testing the previous low is ve
The current price is 86084, and the sharp decline in the morning session without a rebound is the result of the resonance of multiple negative factors: China's regulatory upgrade + the cooling of expectations for a Federal Reserve rate cut + the destruction of the bullish structure at the monthly level, compounded by a significant bearish candle breaking key support on the 4-hour chart. The current price is approaching the 83000 level, which is not a short-term fluctuation but a continuation of a trend decline. The probability of testing the previous low is ve
BTC0.53%
- Reward
- 1
- Comment
- Repost
- Share
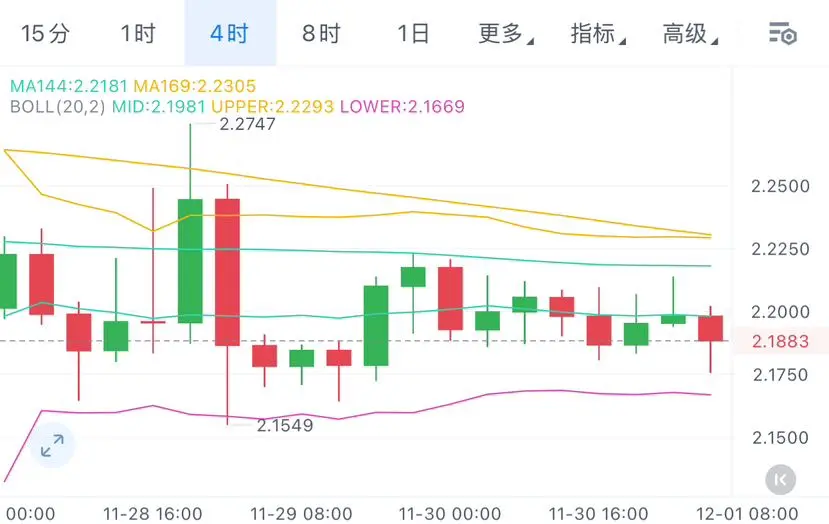
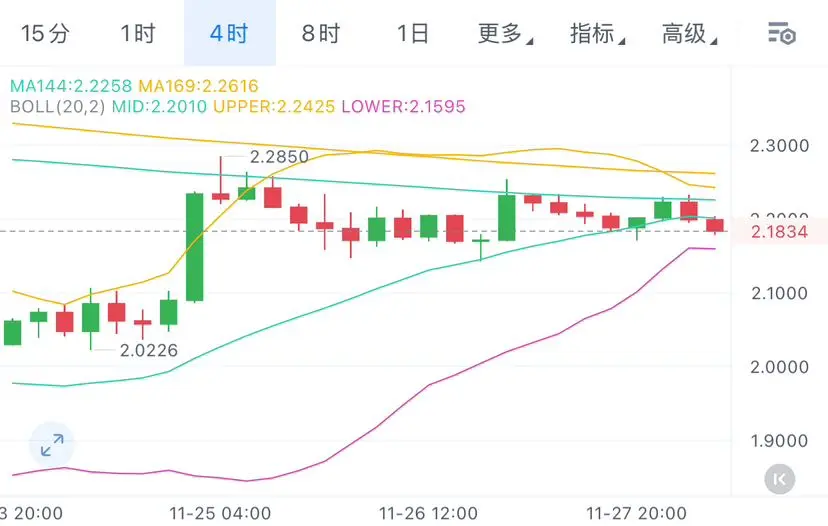
$XRP Current price is 2.18, the 4-hour oscillation downward trend remains unchanged: Rebound encounters resistance and lacks volume support, MACD repair is merely a rhythmic adjustment and not a reversal signal, the continuous shrinkage of volume indicates that long positions have no support, and the current pattern of short positions controlling the market trend is clear, making the probability of breaking below the lower band of the Bollinger Bands extremely high.
Trading suggestion: Short positions around 2.20-2.22, target: 2.16, 2.14.
#成长值抽奖赢iPhone17和周边
Trading suggestion: Short positions around 2.20-2.22, target: 2.16, 2.14.
#成长值抽奖赢iPhone17和周边
XRP-2.04%
- Reward
- like
- Comment
- Repost
- Share
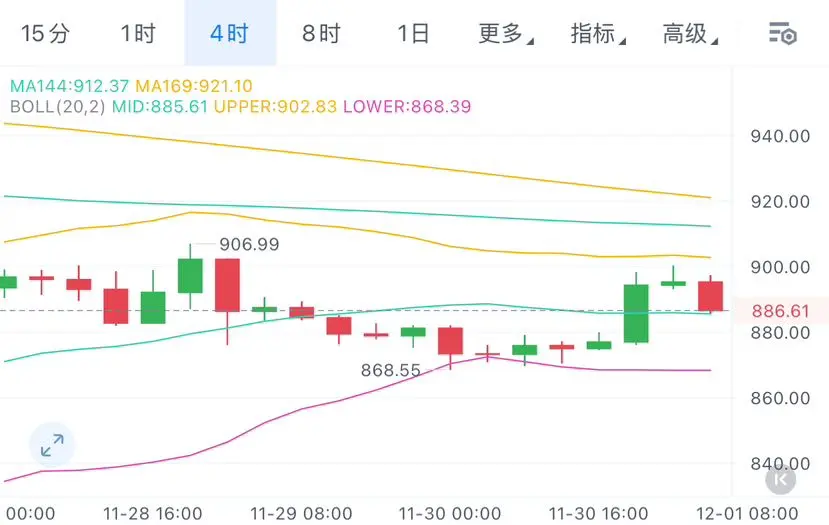
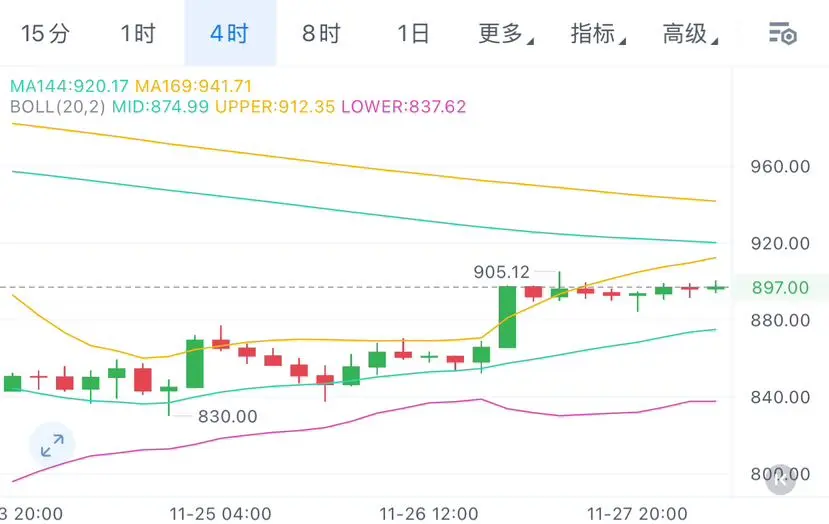
$BNB The current price is 886. The fluctuations within the four-hour descending channel are not a "struggle," but rather a sign of the long positions being completely weakened: multiple attempts to test the upper edge of the channel have been suppressed, indicating strong selling pressure above. Currently, it is close to the central axis but lacks rebound momentum, and the risk of breaking below 880 is extremely high. Once it breaks, the previous rebound gains are very likely to be completely pulled back.
Trading suggestion: sell around 890-895, target 880, 875
#成长值抽奖赢iPhone17和周边
Trading suggestion: sell around 890-895, target 880, 875
#成长值抽奖赢iPhone17和周边
BNB-0.16%
- Reward
- like
- Comment
- Repost
- Share
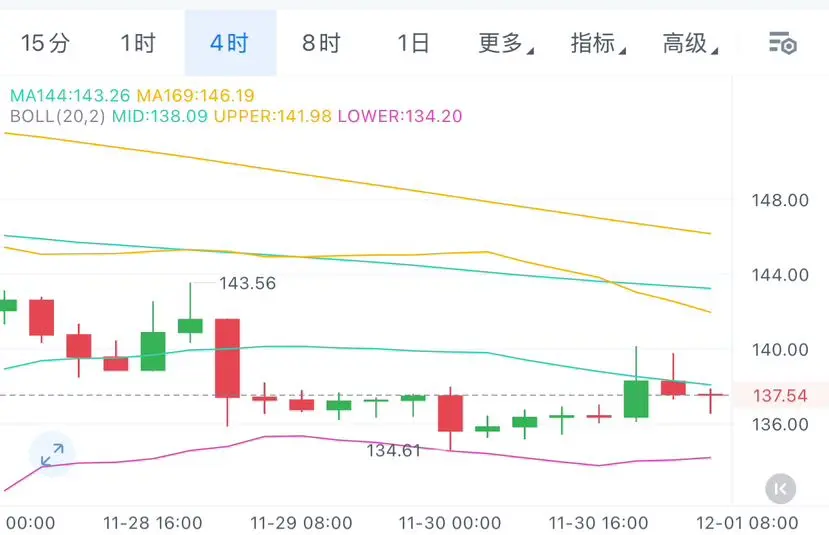
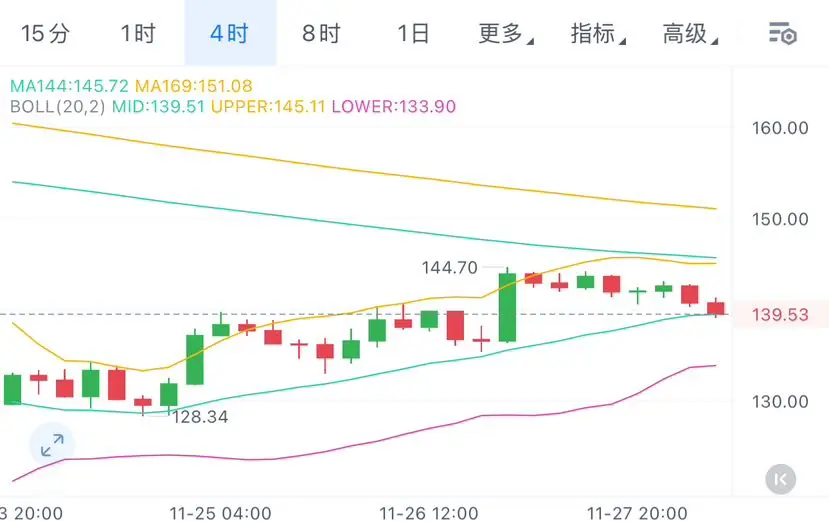
$SOL The current price is 137. The continuous lower wicks over the past 4 hours indicate a passive rebound after being oversold, rather than active long positions entering the market: the price is oscillating around the middle band of the Bollinger Bands without the strength to break through, indicating that the long positions have no offensive momentum. The so-called "weak consolidation" is actually a buildup before the decline, making the probability of dipping to the lower band of the Bollinger Bands or even lower ranges extremely high.
Trading suggestion: short around 140-143, target 135,
Trading suggestion: short around 140-143, target 135,
SOL-0.18%
- Reward
- 1
- Comment
- Repost
- Share
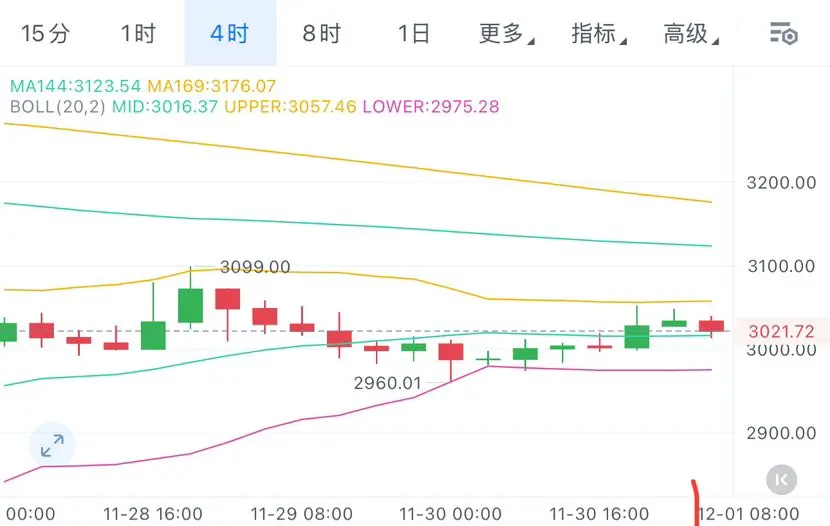
$ETH 12.1 Morning ETH analysis
The current price is 3021. The continuous small bearish and bullish candles in a sideways trend do not indicate "funds hesitation," but rather a signal of exhausted bullish momentum: the upper pressure has not been broken + there is no incremental capital pushing the price, the longer the sideways trend lasts, the higher the risk of a decline. Currently, it is close to the middle line of the Bollinger Bands, and the probability of falling to the lower line is far greater than that of rebounding upwards.
Trading suggestion: Short around 3070-3120, target: 2980, 29
ETH-1.34%
- Reward
- like
- Comment
- Repost
- Share
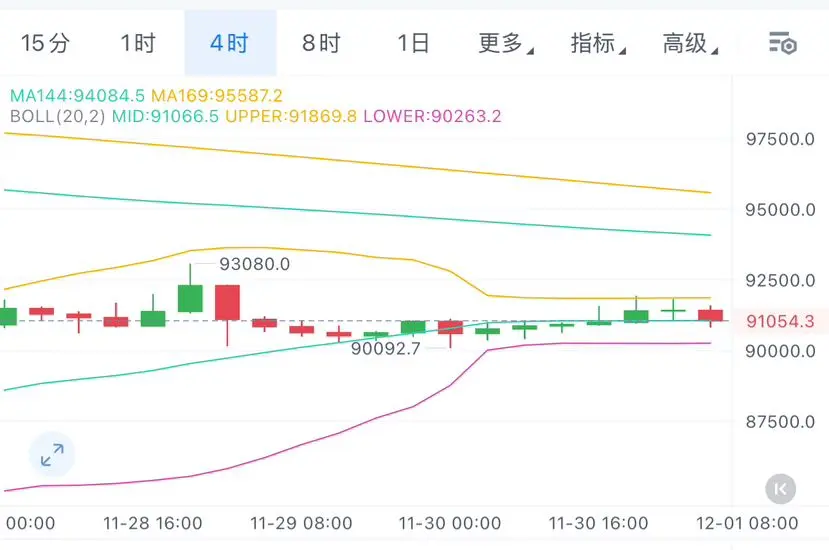
$BTC 12.1 Morning BTC Analysis
Current price is 91054. The bearish candle on the 4-hour level breaking the consecutive bullish trend is not a short-term fluctuation, but a signal of bear strength: although it is temporarily above the 7-day moving average, the horizontal development of the Bollinger Bands indicates that the bullish momentum is exhausted, and it is not a "narrow consolidation". The probability of breaking below the moving average subsequently is higher, and any pullback still presents a high short opportunity.
Trading suggestion: Short around 91500-92000, target: 90500, 90000
#成
BTC0.53%
- Reward
- like
- Comment
- Repost
- Share
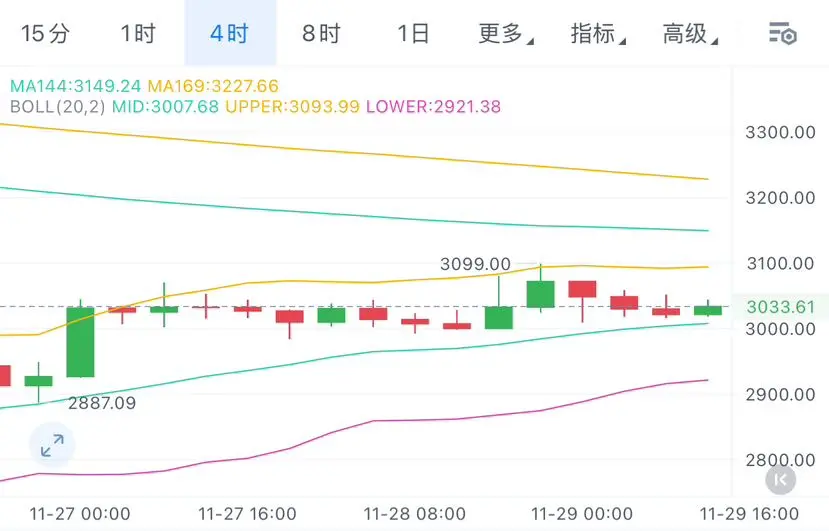
$BTC 11.29 Saturday midday ETH strategy analysis
Current price is 3033, currently at the middle-lower band of the Bollinger Bands with an expanding opening, which is a clear bearish signal: the combination of a large bearish candle and a small bullish candle is not a short-term consolidation, but a weak rebound dominated by bears. The large bearish candle establishes a downward trend, while the small bullish candle lacks volume support. The probability of breaking below the lower band of the Bollinger Bands is much higher than the possibility of a rebound upwards, and the pullback still presen
Current price is 3033, currently at the middle-lower band of the Bollinger Bands with an expanding opening, which is a clear bearish signal: the combination of a large bearish candle and a small bullish candle is not a short-term consolidation, but a weak rebound dominated by bears. The large bearish candle establishes a downward trend, while the small bullish candle lacks volume support. The probability of breaking below the lower band of the Bollinger Bands is much higher than the possibility of a rebound upwards, and the pullback still presen
BTC0.53%
- Reward
- like
- Comment
- Repost
- Share
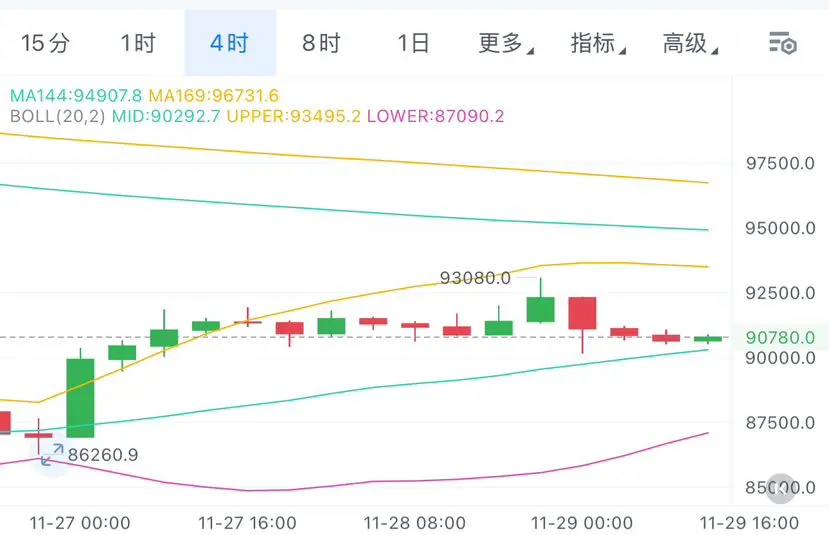
$BTC 11.29 Saturday midday BTC analysis
The current price is 90780. After a peak of 93000 yesterday, the subsequent drop is not a "normal correction" but a signal of bearish pressure: the oscillation near 91000 currently lacks volume support, and the limited volatility over the weekend is actually a manifestation of insufficient bullish momentum. The risk of breaking below the lower boundary of the range is higher than the probability of breaking above the upper boundary, and any rebound still presents a high shorting opportunity.
Trading suggestion: Short near 91300-91800, target: 90000, 8950
BTC0.53%
- Reward
- like
- Comment
- Repost
- Share
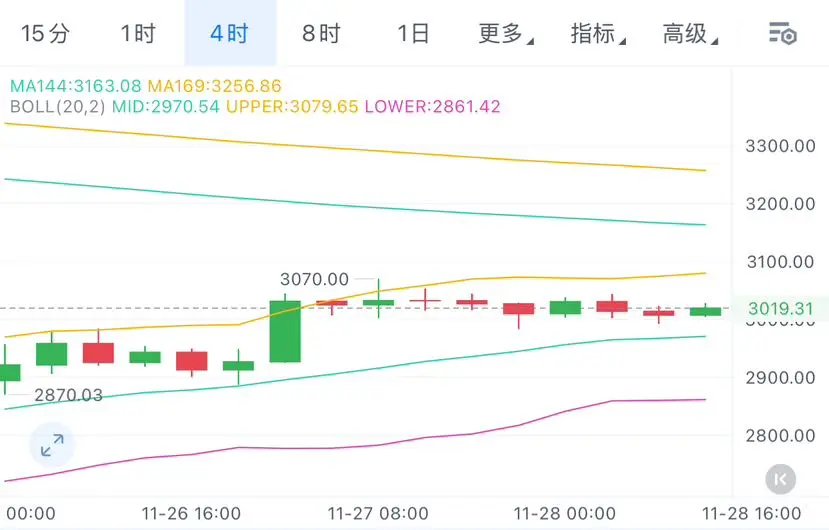
$ETH 11.28 Evening ETH strategy analysis
The current price is 3050. The so-called "breakout with volume increase" in the four-hour timeframe is a weak pullback driven by short-term sentiment, not a trend establishment: after the increase in volume, the price has not stabilized at the key resistance level. The current pullback is a signal of bearish strength, rather than a "buying opportunity"; the slow rise during the day lacks sustained volume support. The so-called "bullish dominance" is merely a manifestation of oscillation, and the risk of a subsequent decline far exceeds the probability o
The current price is 3050. The so-called "breakout with volume increase" in the four-hour timeframe is a weak pullback driven by short-term sentiment, not a trend establishment: after the increase in volume, the price has not stabilized at the key resistance level. The current pullback is a signal of bearish strength, rather than a "buying opportunity"; the slow rise during the day lacks sustained volume support. The so-called "bullish dominance" is merely a manifestation of oscillation, and the risk of a subsequent decline far exceeds the probability o
ETH-1.34%
- Reward
- like
- Comment
- Repost
- Share
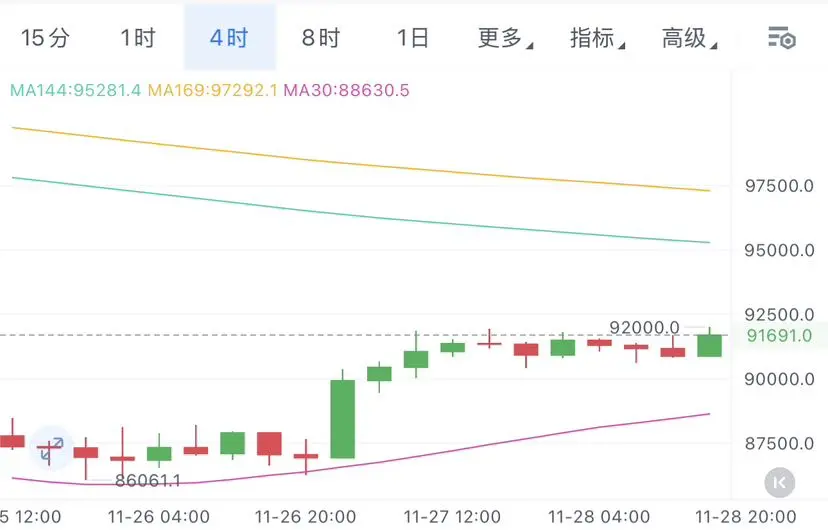
$BTC 11.28 Evening BTC Analysis
The current price is 91691, and the current 4-hour level "high-level consolidation" is not a continuation of the bullish trend: technical indicators are overbought but the volume continues to shrink, with a net capital outflow of 28.63 million USD. The so-called "Bollinger Bands biased to the upside" is a weak rebound driven by short-term sentiment, not a trend strengthening. The key resistance level has shown selling pressure, and the subsequent correction risk is higher than the upward space.
Trading suggestion: Short around 92000-92800, target: 91000, 90500
BTC0.53%
- Reward
- 1
- Comment
- Repost
- Share
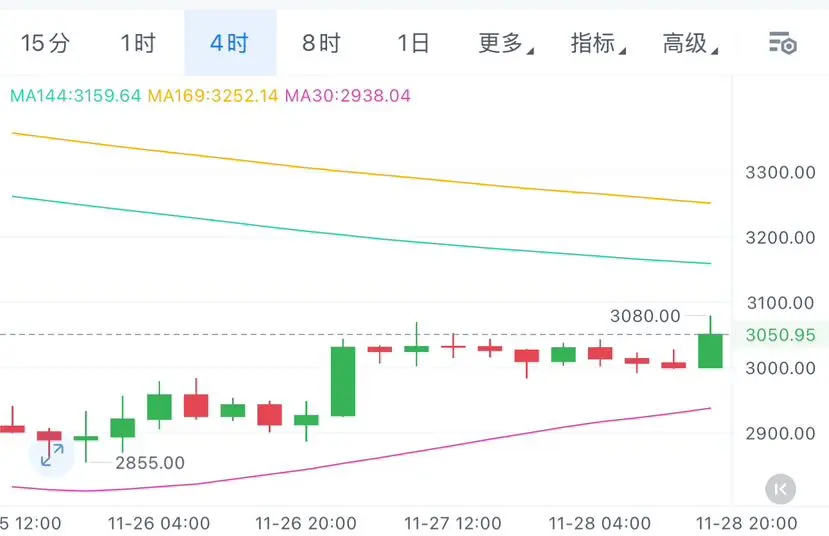
$ETH 11.28 midday BTC analysis
The current price is 3019. The current range oscillation is not due to "light trading," but rather a manifestation of insufficient bullish momentum: the so-called "golden cross" pattern is close to the zero axis in value, which is actually a weak balance under the divergence of bulls and bears, not an effective bullish signal. In the direction selection for the evening, the risk of breaking down is greater than the rebound space, and after a volatile pullback, it still presents an opportunity for high shorts.
Trading suggestion: Short near 3050-3080, target: 2950
ETH-1.34%
- Reward
- 1
- Comment
- Repost
- Share
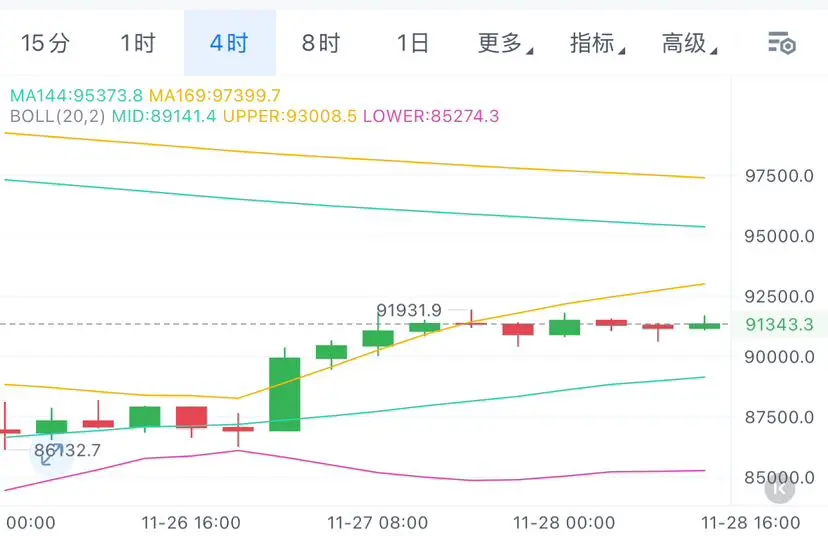
$BTC 11.28 midday BTC analysis
The current price is 91343. The four-hour consecutive downward trend is not a sign that the "bulls cannot be stopped"; rather, it exposes the lack of rebound momentum: the so-called "breakout with volume must lead to a rise" is a misjudgment of the trend. The current price has not broken through the key resistance level, and the volume during the rebound continues to shrink. The so-called "bulls going crazy" is merely a weak fluctuation driven by short-term sentiment, and the risk of a subsequent decline far outweighs the potential for upward movement.
Operation
BTC0.53%
- Reward
- 1
- 1
- Repost
- Share
GateUser-68c6ac06:
I also think to do it like this first, then like that, and then it becomes like this.$XRP Current price 2.18, the contraction of the Bollinger Bands at the four-hour level indicates an intensifying divergence between long and short positions, not a consolidation signal: the MACD red bars oscillating around the zero axis suggest insufficient bullish momentum, the so-called "strong bullish" on the daily chart is a weak rebound driven by short-term sentiment, lacking sustained volume support. In today’s directional choice, the risk of breaking down is greater than the rebound space, and even after a rebound, it is still a high short opportunity.
Trading advice: Short near 2.20-2
Trading advice: Short near 2.20-2
XRP-2.04%
- Reward
- like
- Comment
- Repost
- Share
$BNB Current price 897, the short-term pullback on the four-hour level is not a consolidation, the daily chart MACD golden cross pattern is a technical correction after being oversold, lacking sustained volume support: the death cross signal has appeared on the hourly level, the current rebound has not broken through the key resistance level, the so-called "long positions trend foundation is solid" is just a short-term emotional facade, the subsequent pullback risk is higher than the upward potential, and after the rebound, it remains a high short opportunity.
Trading suggestion: Short near 9
Trading suggestion: Short near 9
BNB-0.16%
- Reward
- like
- Comment
- Repost
- Share
$SOL The current price is 139. Although it is at the middle and lower bands of the Bollinger Bands on the one-hour chart, with support at the lower band, the small bearish and bullish candlestick patterns with short wicks are not a balance between bulls and bears, but rather a passive fluctuation dominated by shorts: the so-called "difficult to form effective breakouts" is merely a short-term consolidation appearance. The current price is close to the support level, and the risk of breaking downward is greater than the rebound space. In this fluctuation, maintaining short positions is still t
SOL-0.18%
- Reward
- like
- Comment
- Repost
- Share
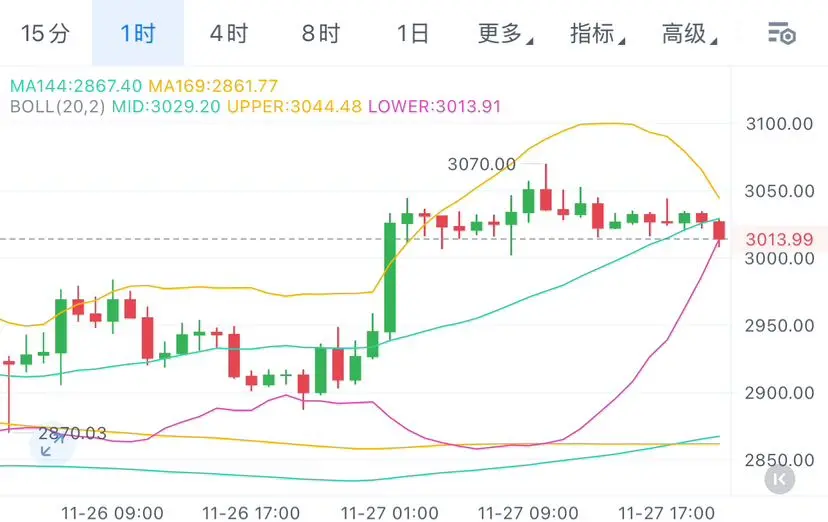
$ETH 11.28 Morning ETH analysis
Current price 3001, the upward momentum is weakening, and the bears are gaining strength, a double top structure has formed. The indicators on the 1-hour level are turning downwards. The so-called "pullback" is merely a short-term fluctuation in a weak trend and not a reversal signal. The overall bearish trend remains unchanged, and the pullback is precisely the opportunity for high short positions.
Operation suggestion: Short around 3050-3080, target: 2950, 2900
#成长值抽奖赢iPhone17和周边
ETH-1.34%
- Reward
- like
- Comment
- Repost
- Share
$BTC 11.28 Morning BTC strategy analysis
The current price is 90948. The so-called bottoming structure at the 4-hour level is a weak repair driven by short-term sentiment: the MACD golden cross on the hourly chart is a technical signal after an oversold condition, lacking sustained volume support. Additionally, while oscillating around the 92,000 mark, there has been a net outflow of funds amounting to 319 million USD. The short-term moving average support is not solid, and the risk of a pullback is higher than the potential for upward movement.
Trading suggestion: Short around 91500-92000, ta
BTC0.53%
- Reward
- like
- Comment
- Repost
- Share
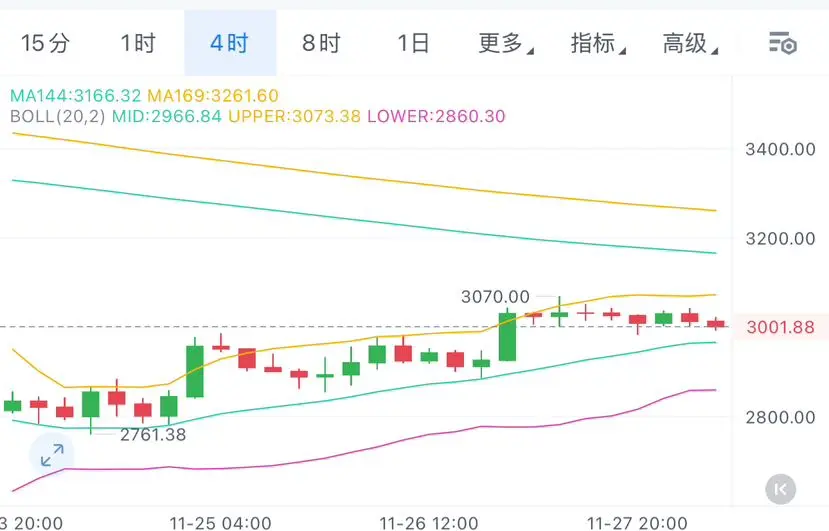
$ETH 11.27 Evening ETH strategy analysis
The current price is 3013. The four-hour level has seen a continuous rebound and a breakthrough of the upper Bollinger Band, which is a short-term sentiment-driven pullback, not a trend reversal: the so-called "MACD and KDJ golden cross resonance" is a technical repair after an oversell, lacking sustained volume support, and the price is still within the pressure zone of the previous downtrend. The indicators strengthening is unlikely to change the overall bearish dominance, and there is a high risk of a pullback after subsequent highs.
Trading suggesti
ETH-1.34%
- Reward
- like
- Comment
- Repost
- Share
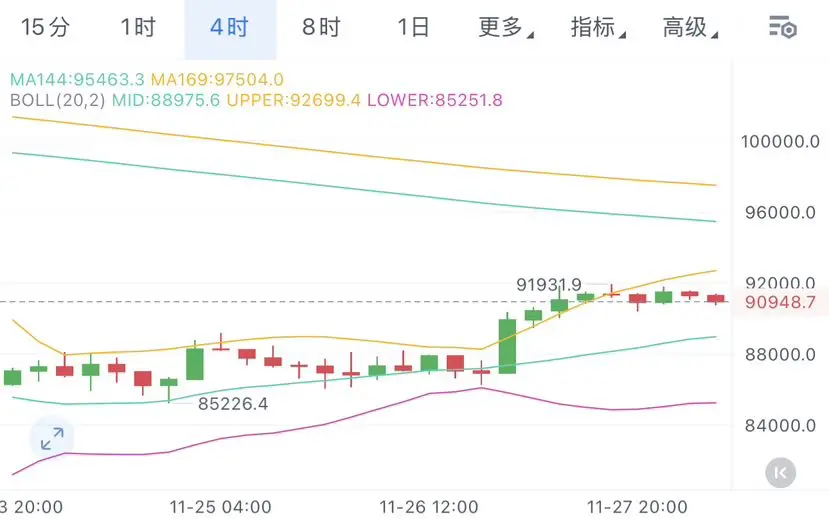
$BTC 11.27 Evening BTC Analysis
The current price is 91245. The four-hour level rebound encounters MA144 and MA169 strong resistance. The current expansion of the MACD red bar is a weak rebound driven by short-term sentiment, not a signal of momentum continuation: the price is close to the resistance level, and the rebound lacks sustained volume support, leading to a higher risk of a subsequent pullback.
Trading suggestion: Short around 92000-92500, target: 90700, 90000
#成长值抽奖赢iPhone17和周边
BTC0.53%

- Reward
- like
- Comment
- Repost
- Share