
**Date: **Mon, Jan 05, 2026 | 07:55 AM GMT
As 2026 kicks off, the broader cryptocurrency market is showing renewed stability. Ethereum (ETH) is up around 4% on the week, and improving sentiment is gradually spreading across major altcoins — including Ethena (ENA).
ENA has already surged more than 14% on a weekly basis, but the more important development is unfolding beneath the surface. While short-term strength is encouraging, the bigger story lies in the structure forming on the chart. Recent price action suggests a meaningful shift in market behavior — one that could mark the early stages of a bullish continuation if key resistance levels are reclaimed.
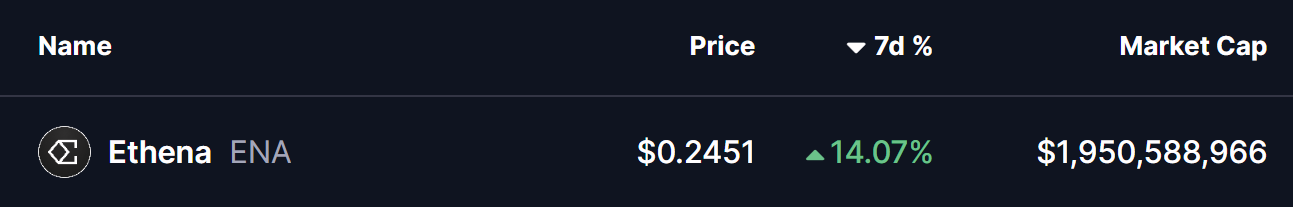
Source: Coinmarketcap
Rounding Bottom in Play
On the daily timeframe, ENA appears to be forming a rounding bottom pattern, a classic bullish reversal structure that typically develops after a prolonged corrective phase.
The setup began after ENA faced a firm rejection near the $0.3028–$0.2837 resistance zone late last month. That rejection triggered a sharp decline, dragging price down toward the $0.1935 area. Importantly, sellers failed to push price meaningfully lower from there, and strong demand emerged at those levels. Over time, ENA stabilized, volatility compressed, and price began to curl higher — completing the rounded base structure.
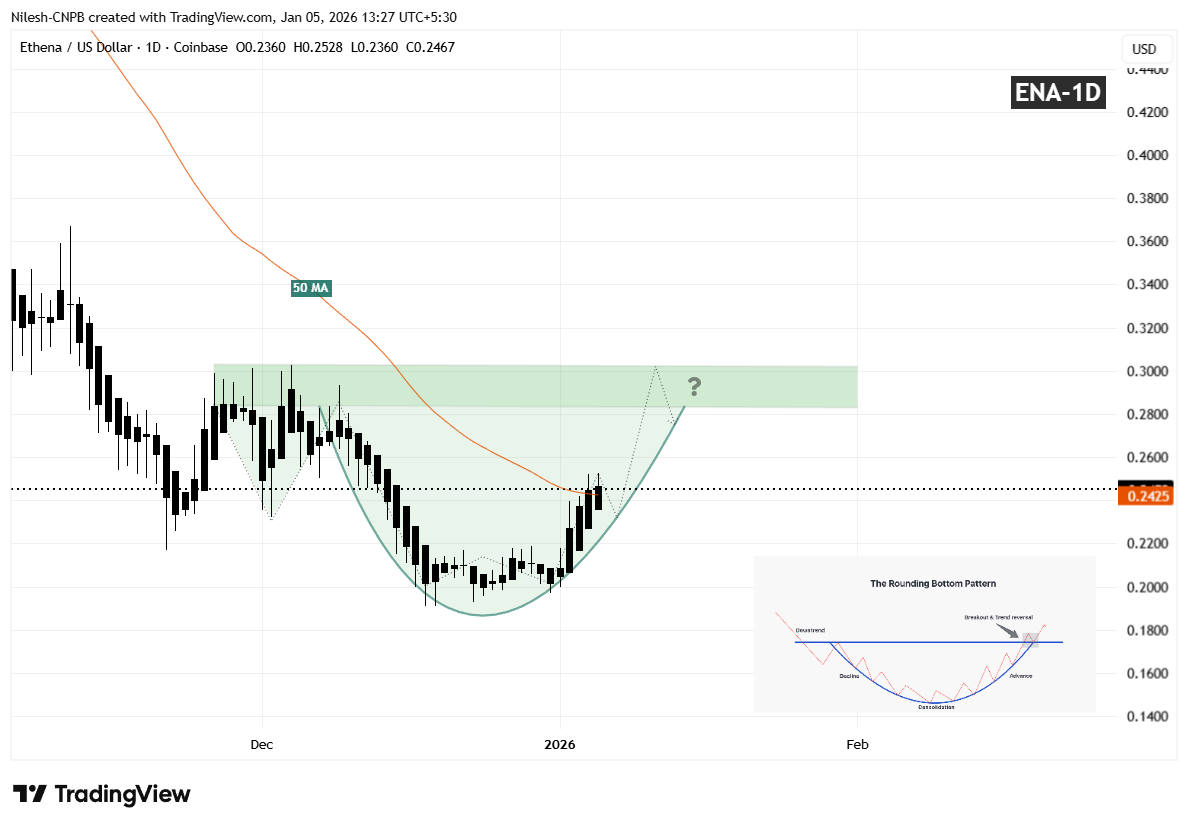
Ethena (ENA) Daily Chart/Coinsprobe (Source: Tradingview)
Since carving out that bottom, ENA has started to move higher in a smooth, rounded fashion, closely matching the textbook characteristics of a developing rounding bottom. The recent recovery has also brought price back toward the 50-day moving average near $0.2451, a level that previously acted as resistance and is now being tested as potential support.
What’s Next for ENA?
If ENA continues to hold above the 50-day MA, that level could act as a solid short-term base for further upside attempts. A clean and decisive breakout above the $0.3028–$0.2837 resistance zone, followed by sustained acceptance above it, would validate the entire reversal pattern and likely open the door for a broader bullish expansion phase.
Until such a breakout occurs, the pattern remains in development. Short-term consolidation or shallow pullbacks remain possible as price digests recent gains. However, as long as ENA continues to form higher lows above the established base, the broader bottoming structure remains intact and constructive.
For now, the chart suggests ENA is approaching a critical confirmation phase — one that could determine whether this recovery evolves into a sustained bullish trend as the new year unfolds.
Disclaimer: The views and analysis presented in this article are for informational purposes only and reflect the author’s perspective, not financial advice. Technical patterns and indicators discussed are subject to market volatility and may or may not yield the anticipated results. Investors are advised to exercise caution, conduct independent research, and make decisions aligned with their individual risk tolerance.
About Author: Nilesh Hembade is the Founder and Lead Author of Coinsprobe, with over 5 years of experience in the cryptocurrency and blockchain industry. Since launching Coinsprobe in 2023, he has been providing daily, research-driven insights through in-depth market analysis, on-chain data, and technical research.
Disclaimer: The information on this page may come from third parties and does not represent the views or opinions of Gate. The content displayed on this page is for reference only and does not constitute any financial, investment, or legal advice. Gate does not guarantee the accuracy or completeness of the information and shall not be liable for any losses arising from the use of this information. Virtual asset investments carry high risks and are subject to significant price volatility. You may lose all of your invested principal. Please fully understand the relevant risks and make prudent decisions based on your own financial situation and risk tolerance. For details, please refer to
Disclaimer.
Related Articles
$0 XRP ETF Netflow Might Be Positive for Price Rebound - U.Today
XRP ETFs reported $0 netflow in 24 hours, indicating a halt in intensive institutional sell-offs after three days. This stability suggests potential accumulation and a price rebound, despite recent stagnation between $1.37 and $1.41.
UToday11m ago
Rich Dad Warns: Biggest Crash in History Coming in 2026! Names BlackRock as Ponzi Scheme, Urges "Skip a Meal a Day" to Buy Bitcoin and Silver
Robert Kiyosaki warned on X platform that 2026 will see the biggest stock market crash in history, and accused BlackRock of being a "Ponzi scheme." He advised investors to purchase Bitcoin, Ethereum, and tangible assets like gold, even suggesting skipping meals to buy silver if lacking funds. He emphasized the importance of taking action and criticized current societal trends.
動區BlockTempo1h ago
DeFi's Yield Winter: Liquidity Stagnation, Leverage Contraction, Arbitrage Opportunities Closed
The DeFi market has entered an "interest rate winter," with mainstream stablecoin lending rates declining sharply due to supply-demand imbalance and liquidity surplus. Weakened arbitrage activities and decreased market risk appetite have led to a sharp drop in stablecoin borrowing demand. Meanwhile, the Sky protocol provides stable yields through real-world assets, becoming the "de facto floor" for on-chain yield rates. Overall, the current environment is prompting investors to reassess their risk strategies, and falling interest rates may become the foundation for DeFi's future recovery.
PANews1h ago
Zcash Price Rallies 10% on Major VC Funding, but Bulls Must Break $250
March 12, 2026 2:48 am EDT
TheCoinRepublic1h ago
Litecoin Crypto Expands DeFi Access Through Base: Is LTC Price On The Verge Of A Rally?
March 12, 2026 6:50 am EDT
TheCoinRepublic1h ago
Bitcoin Maintains Resilience Near $70,000, Analysts Say Deleveraging Paves Way for Next Rally
On March 12, analyst Omkar Godbole noted that Bloomberg predicted Bitcoin could fall to $10,000, but the industry considered this forecast unreasonable. The Deribit platform showed that approximately $800 million in put options are concentrated at $20,000, with some traders preparing for a possible crash. Despite external market volatility, Bitcoin remained around $70,000, demonstrating resilience. Analysis indicated that market consolidation could lay the foundation for subsequent price movements.
GateNews1h ago