Historical Benchmark: The “Pullback Curse” of Federal Reserve Chair Changes
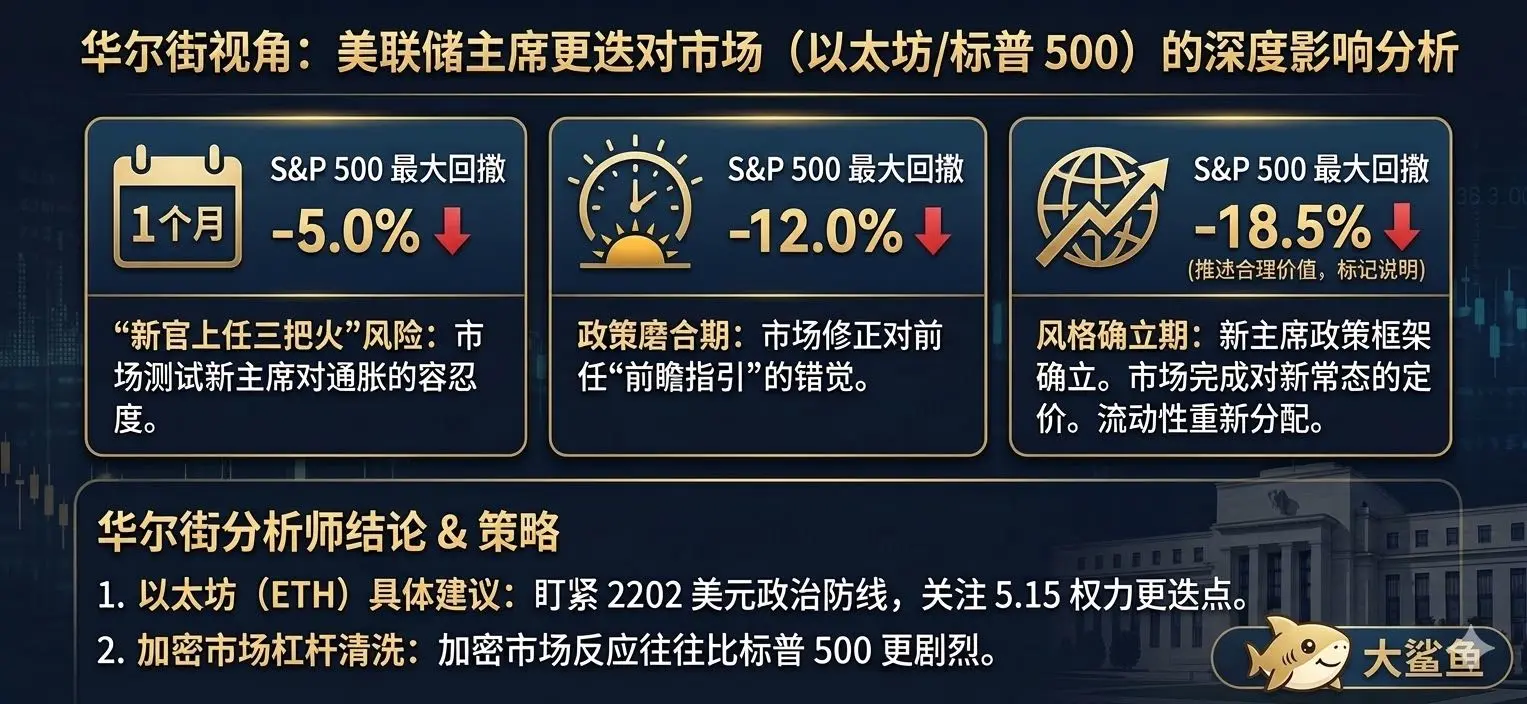
Figure 1: Based on 96 years of data from 1930 to 2026, the S&P 500’s market performance after the newly appointed Federal Reserve Chair takes office shows extremely strong statistical regularity.
Figure 2: Using 55 years of historical big data since Nasdaq’s founding in 1971, along with market volatility feedback during past Fed Chair transitions, I provide you with an in-depth breakdown of this “Nasdaq–Fed Chair Transition Volatility Prediction Atlas.”